
Page 11 - FINAL CFA II SLIDES JUNE 2019 DAY 9
P. 11
LOS 34.d: Describe the assumptions concerning the READING 34: THE TERM STRUCTURE AND
evolution of spot rates in relation to forward rates
implicit in active bond portfolio management. INTEREST RATE DYNAMICS
MODULE 34.2: SPOT AND FORWARD RATES, PART 2
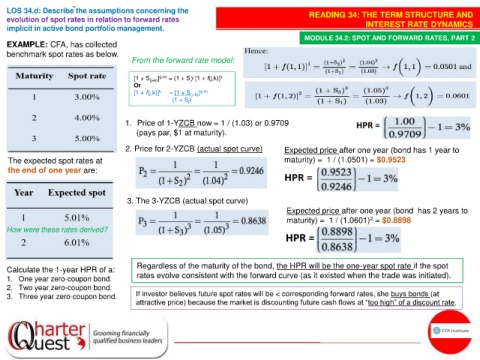
EXAMPLE: CFA, has collected
benchmark spot rates as below.
From the forward rate model:
[1 + S (j+k) ] (j+k) = (1 + S) [1 + f(j,k)] k
j
j
Or
[1 + f(j,k)] k = [1 + S (j+k) ] (j+k)
(1 + S) j j
1. Price of 1-YZCB now = 1 / (1.03) or 0.9709
(pays par, $1 at maturity).
2. Price for 2-YZCB (actual spot curve) Expected price after one year (bond has 1 year to
The expected spot rates at maturity) = 1 / (1.0501) = $0.9523
the end of one year are:
3. The 3-YZCB (actual spot curve)
Expected price after one year (bond has 2 years to
maturity) = 1 / (1.0601) = $0.8898
2
How were these rates derived?
Regardless of the maturity of the bond, the HPR will be the one-year spot rate if the spot
Calculate the 1-year HPR of a:
1. One year zero-coupon bond. rates evolve consistent with the forward curve (as it existed when the trade was initiated).
2. Two year zero-coupon bond.
3. Three year zero-coupon bond. If investor believes future spot rates will be < corresponding forward rates, she buys bonds (at
attractive price) because the market is discounting future cash flows at “too high” of a discount rate.