
Page 11 - PowerPoint Presentation
P. 11
LOS 34.d: Describe the assumptions concerning the READING 34: THE TERM STRUCTURE AND
evolution of spot rates in relation to forward rates
implicit in active bond portfolio management. INTEREST RATE DYNAMICS
MODULE 34.2: SPOT AND FORWARD RATES, PART 2
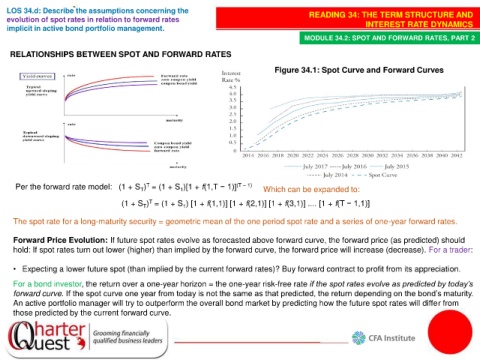
RELATIONSHIPS BETWEEN SPOT AND FORWARD RATES
Figure 34.1: Spot Curve and Forward Curves
Per the forward rate model: (1 + S ) = (1 + S )[1 + f(1,T − 1)] (T – 1) Which can be expanded to:
T
T
1
T
(1 + S ) = (1 + S ) [1 + f(1,1)] [1 + f(2,1)] [1 + f(3,1)] .... [1 + f(T − 1,1)]
T
1
The spot rate for a long-maturity security = geometric mean of the one period spot rate and a series of one-year forward rates.
Forward Price Evolution: If future spot rates evolve as forecasted above forward curve, the forward price (as predicted) should
hold: If spot rates turn out lower (higher) than implied by the forward curve, the forward price will increase (decrease). For a trader:
• Expecting a lower future spot (than implied by the current forward rates)? Buy forward contract to profit from its appreciation.
For a bond investor, the return over a one-year horizon = the one-year risk-free rate if the spot rates evolve as predicted by today’s
forward curve. If the spot curve one year from today is not the same as that predicted, the return depending on the bond’s maturity.
An active portfolio manager will try to outperform the overall bond market by predicting how the future spot rates will differ from
those predicted by the current forward curve.