
Page 12 - PowerPoint Presentation
P. 12
LOS 34.d: Describe the assumptions concerning the READING 34: THE TERM STRUCTURE AND
evolution of spot rates in relation to forward rates
implicit in active bond portfolio management. INTEREST RATE DYNAMICS
MODULE 34.2: SPOT AND FORWARD RATES, PART 2
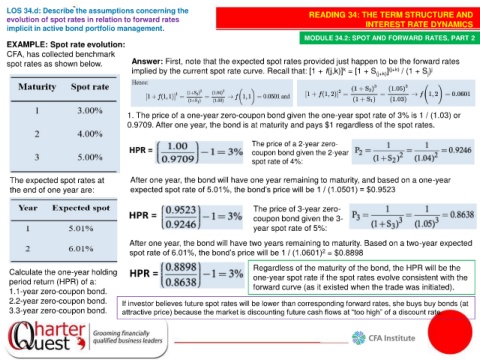
EXAMPLE: Spot rate evolution:
CFA, has collected benchmark
spot rates as shown below. Answer: First, note that the expected spot rates provided just happen to be the forward rates
implied by the current spot rate curve. Recall that: [1 + f(j,k)] = [1 + S (j+k) ] (j+k) / (1 + S ) j
k
j
1. The price of a one-year zero-coupon bond given the one-year spot rate of 3% is 1 / (1.03) or
0.9709. After one year, the bond is at maturity and pays $1 regardless of the spot rates.
The price of a 2-year zero-
coupon bond given the 2-year
spot rate of 4%:
The expected spot rates at After one year, the bond will have one year remaining to maturity, and based on a one-year
the end of one year are: expected spot rate of 5.01%, the bond’s price will be 1 / (1.0501) = $0.9523
The price of 3-year zero-
coupon bond given the 3-
year spot rate of 5%:
After one year, the bond will have two years remaining to maturity. Based on a two-year expected
2
spot rate of 6.01%, the bond’s price will be 1 / (1.0601) = $0.8898
Regardless of the maturity of the bond, the HPR will be the
Calculate the one-year holding
period return (HPR) of a: one-year spot rate if the spot rates evolve consistent with the
1.1-year zero-coupon bond. forward curve (as it existed when the trade was initiated).
2.2-year zero-coupon bond. If investor believes future spot rates will be lower than corresponding forward rates, she buys buy bonds (at
3.3-year zero-coupon bond. attractive price) because the market is discounting future cash flows at “too high” of a discount rate.