
Page 178 - Computer Graphics Handout
P. 178
4.8.1 Culling
For a convex object, such as the cube, faces whose 178ormal point away from the viewer are never visible and can be eliminated or
culled before the rasterizer.We can turn on culling in OpenGL by enabling it as follows:
glEnable(GL_CULL_FACE);
However, culling is guaranteed to produce a correct image only if we have a single convex object. Often we can use culling in addition
to the z-buffer algorithm (which works with any collection of polygons). For example, suppose that we have a scene composed of a
collection of n cubes. If we use only the z-buffer algorithm, we pass 6n polygons through the pipeline. If we enable culling, half the
polygons can be eliminated early in the pipeline, and thus only 3n polygons pass through all stages of the pipeline. We consider
culling further in Chapter 6.
4.9 DISPLAYING MESHES
We now have the tools to walk through a scene interactively by having the camera parameters
change in response to user input. Before introducing a simple interface, let’s consider another
example of data display: mesh plots. A mesh is a set of polygons that share vertices and edges. A
general mesh, as shown in Figure 4.42, may contain polygons with any number of vertices and
require a moderately sophisticated data structure to store and display efficiently. Rectangular and
triangular meshes, such as we introduced in Chapter 2 for modeling a sphere, are much simpler to
work with and are useful for a wide variety of applications. Here we introduce rectangular meshes
for the display of height data. Height data determine a surface, such as terrain, through either a
function that gives the heights above a reference value, such as elevations above sea level, or
through samples taken at various points on the surface. Suppose that the heights are given by y
through a function y = f (x, z), where x and z are the points on a two-dimensional surface such as a
rectangle.
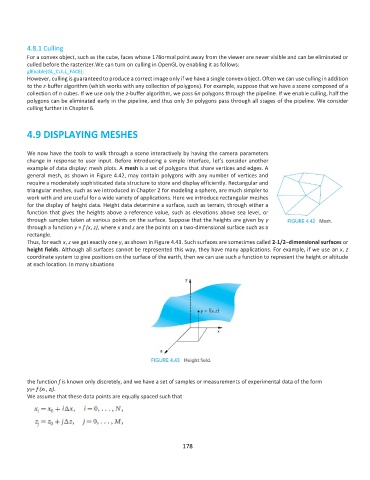
Thus, for each x, z we get exactly one y, as shown in Figure 4.43. Such surfaces are sometimes called 2-1/2–dimensional surfaces or
height fields. Although all surfaces cannot be represented this way, they have many applications. For example, if we use an x, z
coordinate system to give positions on the surface of the earth, then we can use such a function to represent the height or altitude
at each location. In many situations
the function f is known only discretely, and we have a set of samples or measurements of experimental data of the form
yij= f (xi , zj).
We assume that these data points are equally spaced such that
178