
Page 27 - Computer Graphics Handout
P. 27
We can describe such a graphics system with two drawing functions:
moveto(x,y);
lineto(x,y);
Execution of the moveto function moves the pen to the location (x, y) on the paper without leaving a mark. The lineto function
moves the pen to (x, y) and draws a line from the old to the new location of the pen. Once we add a few initialization and termination
procedures, as well as the ability to change pens to alter the drawing color or line thickness, we have a simple—but complete—
graphics system. Here is a fragment of a simple program in such a system:
moveto(0, 0);
lineto(1, 0);
lineto(1, 1);
lineto(0, 1);
lineto(0, 0);
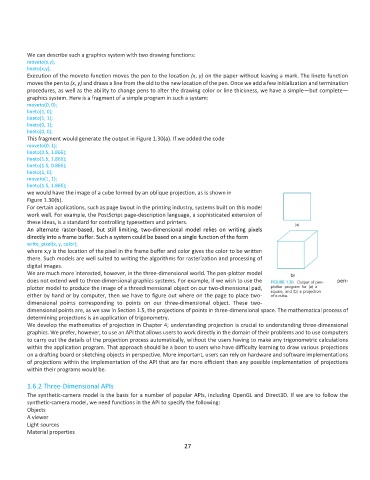
This fragment would generate the output in Figure 1.30(a). If we added the code
moveto(0, 1);
lineto(0.5, 1.866);
lineto(1.5, 1.866);
lineto(1.5, 0.866);
lineto(1, 0);
moveto(1, 1);
lineto(1.5, 1.866);
we would have the image of a cube formed by an oblique projection, as is shown in
Figure 1.30(b).
For certain applications, such as page layout in the printing industry, systems built on this model
work well. For example, the PostScript page-description language, a sophisticated extension of
these ideas, is a standard for controlling typesetters and printers.
An alternate raster-based, but still limiting, two-dimensional model relies on writing pixels
directly into a frame buffer. Such a system could be based on a single function of the form
write_pixel(x, y, color);
where x,y is the location of the pixel in the frame buffer and color gives the color to be written
there. Such models are well suited to writing the algorithms for rasterization and processing of
digital images.
We are much more interested, however, in the three-dimensional world. The pen-plotter model
does not extend well to three-dimensional graphics systems. For example, if we wish to use the pen-
plotter model to produce the image of a threedimensional object on our two-dimensional pad,
either by hand or by computer, then we have to figure out where on the page to place two-
dimensional points corresponding to points on our three-dimensional object. These two-
dimensional points are, as we saw in Section 1.5, the projections of points in three-dimensional space. The mathematical process of
determining projections is an application of trigonometry.
We develop the mathematics of projection in Chapter 4; understanding projection is crucial to understanding three-dimensional
graphics. We prefer, however, to use an API that allows users to work directly in the domain of their problems and to use computers
to carry out the details of the projection process automatically, without the users having to make any trigonometric calculations
within the application program. That approach should be a boon to users who have difficulty learning to draw various projections
on a drafting board or sketching objects in perspective. More important, users can rely on hardware and software implementations
of projections within the implementation of the API that are far more efficient than any possible implementation of projections
within their programs would be.
1.6.2 Three-Dimensional APIs
The synthetic-camera model is the basis for a number of popular APIs, including OpenGL and Direct3D. If we are to follow the
synthetic-camera model, we need functions in the API to specify the following:
Objects
A viewer
Light sources
Material properties
27