
Page 117 - AnnualEducationReport2018-19
P. 117
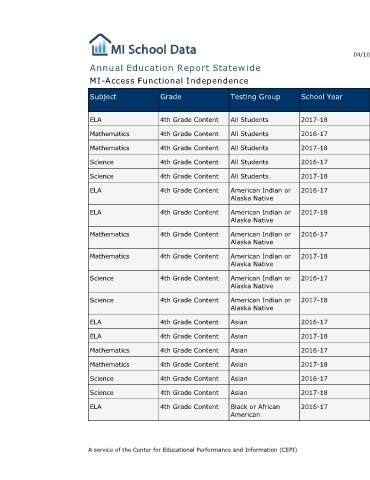
04/10/2019    Percent Emerging Percent Attained Percent Surpassed State Percent Students Proficient  18.6%  41.0%  40.4%  81.4%  31.7%  31.3%  37.0%  68.3%  33.3%  37.0%  29.7%  66.7%  45.6%  26.3%  28.1%  54.4%  51.5%  22.7% 25.8%  48.5%  0.0%  52.6%  47.4% 100.0%  12.5%  12.5%  75.0%  87.5%  25.0%  25.0%  50.0%  75.0%  28.6%  0.0% 71.4%  71.4%  25.0%  50.0%  25.0%  75.0%  40.0%  20.0%  40.0%  60.0%  17.6%  47.1%  35.3%  82.4%  31.6%  52.6% 15.8%  68.4%  64.7%  11.8%  23.5%  35.3%  50.0%  15.0%  35.0%  50.0%  73.3%  6.7%  20.0%  26.7%  77.8%  16.7%  5.6%  22.2%  22.5%  43.4%  34.1%  77.5%  Page 59 of 613


                                  School Year  2017-18  2016-17  2017-18  2016-17  2017-18  2016-17  2017-18  2016-17  2017-18  2016-17  2017-18  2016-17  2017-18  2016-17  2017-18  2016-17  2017-18  2016-17


                                  Testing Group  All Students  All Students  All Students  All Students  All Students  American Indian or  Alaska Native  American Indian or  Alaska Native  American Indian or  Alaska Native  American Indian or  Alaska Native  American Indian or  Alaska Native  American Indian or  Alaska Native  Asian  Asian  Asian  Asian  Asian  Asian  Black or African  American


                        Annual Education Report Statewide

                             MI-Access Functional Independence


                                         4th Grade Content  4th Grade Content  4th Grade Content  4th Grade Content  4th Grade Content  4th Grade Content  4th Grade Content  4th Grade Content  4th Grade Content  4th Grade Content  4th Grade Content  4th Grade Content  4th Grade Content  4th Grade Content  4th Grade Content  4th Grade Content  4th Grade Content  4th Grade Content  A service of the Center for Educational Performance and Information (CEPI)


                                  Grade


                                  Subject  ELA  Mathematics  Mathematics  Science  Science  ELA  ELA  Mathematics  Mathematics  Science  Science  ELA  ELA  Mathematics  Mathematics  Science  Science  ELA