
Page 120 - AnnualEducationReport2018-19
P. 120
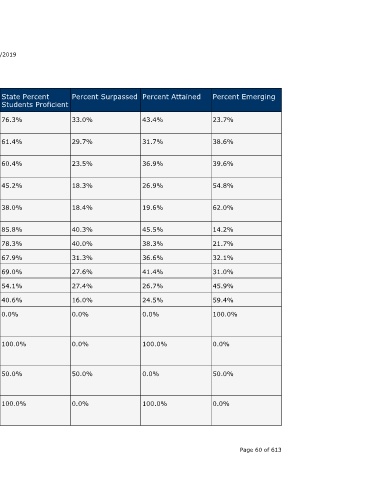
Percent Emerging  23.7%  38.6%  39.6%  54.8%  62.0%  14.2%  21.7%  32.1%  31.0%  45.9%  59.4%  100.0%  0.0%  50.0%  0.0%  Page 60 of 613


                                  Percent Attained  43.4%  31.7%  36.9%  26.9%  19.6%  45.5%  38.3%  36.6%  41.4%  26.7%  24.5%  0.0%  100.0%  0.0%  100.0%


                                  Percent Surpassed  33.0%  29.7%  23.5%  18.3%  18.4%  40.3%  40.0%  31.3%  27.6%  27.4%  16.0%  0.0%  0.0%  50.0%  0.0%


                                  State Percent Students Proficient                                                100.0%              100.0%


                    04/10/2019           76.3%  61.4%   60.4%  45.2%  38.0%  85.8%  78.3%  67.9%  69.0%  54.1%  40.6%  0.0%  50.0%


                                  School Year  2017-18  2016-17  2017-18  2016-17  2017-18  2016-17  2017-18  2016-17  2017-18  2016-17  2017-18  2016-17  2017-18  2016-17  2017-18


                                  Testing Group  Black or African  American  Black or African  American  Black or African  American  Black or African  American  Black or African  American  Hispanic of Any Race  Hispanic of Any Race  Hispanic of Any Race  Hispanic of Any Race  Hispanic of Any Race  Hispanic of Any Race  Native Hawaiian or  Other Pacific  Islander  Native Hawaiian or  Other Pacific  Islander  Native Hawaiian or  Other Pacific  Islander  Native Hawaiian or  Other Pacific  Islander


                        Annual Education Report Statewide

                             MI-Access Functional Independence


                                         4th Grade Content  4th Grade Content  4th Grade Content  4th Grade Content  4th Grade Content  4th Grade Content  4th Grade Content  4th Grade Content  4th Grade Content  4th Grade Content  4th Grade Content  4th Grade Content  4th Grade Content  4th Grade Content  4th Grade Content  A service of the Center for Educational Performance and Information (CEPI)


                                  Grade


                                  Subject  ELA  Mathematics  Mathematics  Science  Science  ELA  ELA  Mathematics  Mathematics  Science  Science  ELA  ELA  Mathematics  Mathematics