
Page 126 - AnnualEducationReport2018-19
P. 126
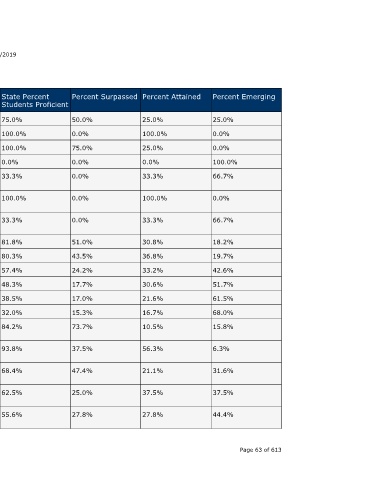
Percent Emerging  25.0%  0.0%  0.0%  100.0%  66.7%  0.0%  66.7%  18.2%  19.7%  42.6%  51.7%  61.5%  68.0%  15.8%  6.3%  31.6%  37.5%  44.4%  Page 63 of 613


                                  Percent Attained  25.0%  100.0%  25.0%  0.0%  33.3%  100.0%  33.3%  30.8%  36.8%  33.2%  30.6%  21.6%  16.7%  10.5%  56.3%  21.1%  37.5%  27.8%


                                  Percent Surpassed  50.0%  0.0%  75.0%  0.0%  0.0%  0.0%  0.0%  51.0%  43.5%  24.2%  17.7%  17.0%  15.3%  73.7%  37.5%  47.4%  25.0%  27.8%


                                  State Percent Students Proficient  100.0%  100.0%  100.0%


                    04/10/2019           75.0%         0.0%  33.3%        33.3%   81.8%  80.3%  57.4%  48.3%  38.5%  32.0%  84.2%  93.8%  68.4%  62.5%  55.6%


                                  School Year  2016-17  2017-18  2016-17  2017-18  2016-17  2016-17  2016-17  2016-17  2017-18  2016-17  2017-18  2016-17  2017-18  2016-17  2017-18  2016-17  2017-18  2016-17


                                  Testing Group  Migrant  Migrant  Migrant  Migrant  Formerly Limited  English Proficiency  Formerly Limited  English Proficiency  Formerly Limited  English Proficiency  All Students  All Students  All Students  All Students  All Students  All Students  American Indian or  Alaska Native  American Indian or  Alaska Native  American Indian or  Alaska Native  American Indian or  Alaska Native  American Indian or  Alaska Native


                        Annual Education Report Statewide

                             MI-Access Functional Independence


                                         4th Grade Content  4th Grade Content  4th Grade Content  4th Grade Content  4th Grade Content  4th Grade Content  4th Grade Content  5th Grade Content  5th Grade Content  5th Grade Content  5th Grade Content  5th Grade Content  5th Grade Content  5th Grade Content  5th Grade Content  5th Grade Content  5th Grade Content  5th Grade Content A service of the Center for Educational Performance and Information (CEPI)


                                  Grade


                                  Subject  Mathematics  Mathematics  Science  Science  ELA  Mathematics  Science  ELA  ELA  Mathematics  Mathematics  Social Studies  Social Studies  ELA  ELA  Mathematics  Mathematics  Social Studies