
Page 25 - 77834_NSAA_Batch
P. 25
CONTINUED AGING OF THE VISITOR PROFILE MARITAL/FAMILY STATUS: LONG-TERM
The visitor age profile shifted slightly older this season, GROWTH IN COUPLES, FAMILIES,
extending a gradual, long-term aging trend. The share of visi- & EMPTY NESTERS; DECLINE IN SINGLES
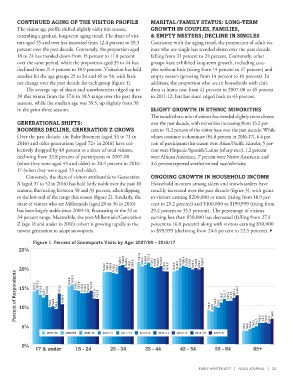
tors aged 55 and over has increased from 12.4 percent to 19.3 Consistent with the aging trend, the proportion of adult vis-
percent over the past decade. Conversely, the proportion aged itors who are single has trended down over the past decade,
18 to 24 has trended down from 15 percent to 11.8 percent falling from 31 percent to 24 percent. Conversely, other
over the same period, while the proportion aged 35 to 44 has groups have exhibited long-term growth, including cou-
declined from 21.4 percent to 18.9 percent. Visitation has held ples without kids (rising from 14 percent to 17 percent) and
steadier for the age groups 25 to 34 and 45 to 54, with little empty nesters (growing from 14 percent to 16 percent). In
net change over the past decade for each group (figure 1). addition, the proportion who are in households with chil-
The average age of skiers and snowboarders edged up to dren at home rose from 41 percent in 2007-08 to 45 percent
39 this winter from the 37.6 to 38.5 range over the past three in 2011-12, but has since edged back to 43 percent.
seasons, while the median age was 39.5, up slightly from 38
in the prior three seasons. SLIGHT GROWTH IN ETHNIC MINORITIES
The racial/ethnic mix of visitors has trended slightly more diverse
GENERATIONAL SHIFTS: over the past decade, with minorities increasing from 13.2 per-
BOOMERS DECLINE, GENERATION Z GROWS cent to 15.2 percent of the visitor base over the past decade. While
Over the past decade, the Baby Boomers (aged 53 to 71 in whites continue to dominate (84.8 percent in 2016-17), 6.4 per-
2016) and older generations (aged 72+ in 2016) have col- cent of participants this season were Asian/Pacific Islander, 5 per-
lectively dropped by 40 percent as a share of total visitors, cent were Hispanic/Spanish/Latino (of any race), 1.2 percent
declining from 33.8 percent of participants in 2007-08 were African American, .7 percent were Native American, and
(when they were aged 44 and older) to 20.4 percent in 2016- 3.6 percent reported another/mixed race/ethnicity.
17 (when they were aged 53 and older).
Conversely, the share of visitors attributable to Generation ONGOING GROWTH IN HOUSEHOLD INCOME
X (aged 37 to 52 in 2016) has held fairly stable over the past 10 Household incomes among skiers and snowboarders have
seasons, fluctuating between 30 and 33 percent, albeit dipping steadily increased over the past decade (figure 3), with gains
to the low end of the range this season (figure 2). Similarly, the in visitors earning $200,000 or more (rising from 18.9 per-
share of visitors who are Millennials (aged 20 to 36 in 2016) cent to 25.2 percent) and $100,000 to $199,999 (rising from
has been largely stable since 2009-10, fluctuating in the 32 to 29.2 percent to 35.5 percent). The percentage of visitors
34 percent range. Meanwhile, the post-Millennials/Generation earning less than $50,000 has decreased (falling from 27.3
Z (age 18 and under in 2016) cohort is growing rapidly as the percent to 16.8 percent) along with visitors earning $50,000
newest generation to adopt snowsports. to $99,999 (declining from 24.6 percent to 22.5 percent).
Figure 1. Percent of Snowsports Visits by Age: 2007/08 – 2016/17
25%
%20.3 %18.3 %20.6 %20.0 %19.2 %19.6 %21.4 %20.2 %20.6 %21.2 %20.1 %19.8 %20.0 %20.3 %18.9 %18.9 %18.9 %19.2 %19.9 %20.4 %20.0 %19.8 %19.4 %19.8 %19.4 %20.0
%18.9
%18.8
%18.7
%18.5
Percent of Respondents 20% %13.7 %14.2 %12.8 %12.1 %12.8 %9.6 %9.8 %9.1 %13.1 %10.4 %15.0 %15.5 %14.1 %13.9 %13.2 %13.2 %13.3 %13.9 %11.9 %11.8 %8.9 %8.5 %9.9 %9.6 %10.9 %11.7 %11.2 %11.3 %12.1 %12.7
15%
10%
5% %3.5 %3.5 %3.9 %4.3 %4.7 %5.5 %5.5 %5.6 %5.3 %6.6
2007/08 2008/09 2009/10 2010/11 2011/12 2012/13 2013/14 2014/15 2015/16 2016/17
0%
17 & under 18 - 24 25 - 34 35 - 44 45 - 54 55 - 64 65+
EARLY WINTER 2017 | NSAA JOURNAL | 23