
Page 28 - 77834_NSAA_Batch
P. 28
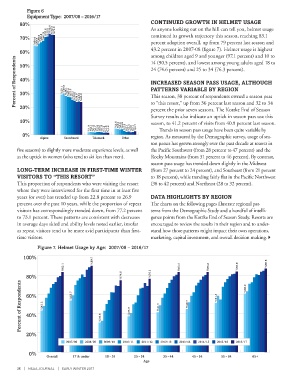
Figure 6
            Equipment Type:  2007/08 – 2016/17
                                                                CONTINUED GROWTH IN HELMET USAGE
         80%          %72.9  %72.3  %72.0                       As anyone looking out on the hill can tell you, helmet usage

         70%      %66.0  %66.8  %67.9  %70.6  %71.0             continued its growth trajectory this season, reaching 83.1
                %64.4  %63.9                                    percent adoption overall, up from 79 percent last season and
                                                                43.2 percent in 2007-08 (figure 7). Helmet usage is highest
         60%                                                    among children aged 9 and younger (97.1 percent) and 10 to
       Percent of Respondents  40%  %29.1  %29.8  %28.1  %27.4  %27.2  %25.3  24 (74.6 percent) and 25 to 34 (76.3 percent).
                                                                14 (90.5 percent), and lowest among young adults aged 18 to
         50%


                                                                INCREASED SEASON PASS USAGE, ALTHOUGH
                                                                PATTERNS VARIABLE BY REGION
         30%
                                 %24.6
                                  %24.0
                                   %23.8
                                 %23.7
                                                                This season, 38 percent of respondents owned a season pass
                                                                to “this resort,” up from 36 percent last season and 32 to 34
         20%
                                                                percent the prior seven seasons. The Kottke End of Season
                                                                Survey results also indicate an uptick in season pass use this
         10%                                      %4.6          season, to 41.2 percent of visits from 40.9 percent last season.
                                      %1.9  %2.1  %1.9  %1.7  %2.0  %2.0  %1.9  %1.4  %1.6  %1.6  %4.2  %3.9  %4.0  %2.8  %2.1  %2.4  %2.0  %2.1  %2.7  Trends in season pass usage have been quite variable by
          0%                                                    region. As measured by the Demographic survey, usage of sea-
                  Alpine    Snowboard   Telemark    Other
                                                                son passes has grown strongly over the past decade at resorts in
        five seasons) to slightly more moderate experience levels, as well   the Pacific Southwest (from 28 percent to 47 percent) and the
        as the uptick in women (who tend to ski less than men).  Rocky Mountains (from 31 percent to 46 percent). By contrast,
                                                                season pass usage has trended down slightly in the Midwest
        LONG-TERM INCREASE IN FIRST-TIME WINTER                 (from 27 percent to 24 percent), and Southeast (from 21 percent
        VISITORS TO “THIS RESORT”                               to 18 percent), while trending fairly flat in the Pacific Northwest
        This proportion of respondents who were visiting the resort   (38 to 42 percent) and Northeast (28 to 32 percent).
        where they were interviewed for the first time in at least five
        years (or ever) has trended up from 22.8 percent to 26.9   DATA HIGHLIGHTS BY REGION
        percent over the past 10 years, while the proportion of repeat   The charts on the following pages illustrate regional pat-
        visitors has correspondingly trended down, from 77.2 percent   terns from the Demographic Study and a handful of intelli-
        to 73.1 percent. These patterns are consistent with decreases   gence points from the Kottke End of Season Study. Resorts are
        in average days skied and ability levels noted earlier, insofar   encouraged to review the results in their region and to under-
        as repeat visitors tend to be more avid participants than first-  stand how those patterns might impact their own operations,
        time visitors.                                          marketing, capital investment, and overall decision making.

                 Figure 7. Helmet Usage by Age:  2007/08 – 2016/17
           100%                         %89.7

                            %83.1                                           %83.2       %83.2       %83.8       %86.8

            80%                                     %74.6       %76.3                                   %60.9
          Percent of Respondents  60%  %43.2  %53.7  %30.8  %37.3  %41.5       %44.7        %51.3


            40%


            20%
                             2007/08  2008/09  2009/10  2010/11  2011/12  2012/13  2013/14  2014/15  2015/16  2016/17

             0%
                    Overall    17 & under    18 - 24     25 - 34     35 - 44     45 - 54     55 - 64      65+
                                                             Age
        26  | NSAA JOURNAL  |  EARLY WINTER 2017