
Page 27 - 77834_NSAA_Batch
P. 27
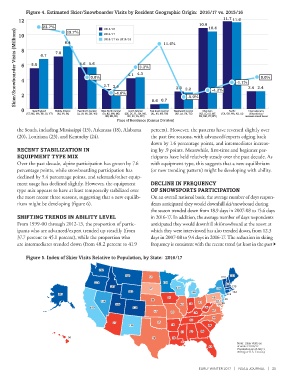
Figure 4. Estimated Skier/Snowboarder Visits by Resident Geographic Origin: 2016/17 vs. 2015/16
11.7 11.6
12
10.8
22.7% 8.4 2015/16 11.4% 10.4
Skier/Snowboarder Visits (Millions) 8 5.5 6.7 7.0 5.6 5.6 2.7 2.5 4.1 4.3 2.3 2.2 -1.1% 2.4 2.4
19.7%
2016/17
10
2016/17 vs. 2015/16
6
3.2%
0.0%
0.0%
4
-4.6%
2
-5.9%
0.6 0.7
0 New England Middle Atlantic East North Central West North Central South Atlantic East South Central West South Central Mountain -4.2% Pacific International &
(CT, ME, MA, NH, RI, VT) (NJ, NY, PA) (IL, IN, MI, OH, WI) (IA, KS, MN, MO, (DE, DC, FL, GA, MD, (AL, KY, MS, TN) (AR, LA, OK, TX) (AZ, CO, ID, MT, (CA, OR, WA, AK, HI) US territories/
NE, ND, SD) NC, SC, VA, WV) NV, NM, UT, WY) overseas armed forces
Place of Residence (Census Division)
the South, including Mississippi (13), Arkansas (18), Alabama percent). However, the patterns have reversed slightly over
(20), Louisiana (23), and Kentucky (24). the past five seasons, with advanced/experts edging back
down by 1.6 percentage points, and intermediates increas-
RECENT STABILIZATION IN ing by .9 points. Meanwhile, first-time and beginner par-
EQUIPMENT TYPE MIX ticipants have held relatively steady over the past decade. As
Over the past decade, alpine participation has grown by 7.6 with equipment type, this suggests that a new equilibrium
percentage points, while snowboarding participation has (or new trending pattern) might be developing with ability.
declined by 5.4 percentage points, and telemark/other equip-
ment usage has declined slightly. However, the equipment DECLINE IN FREQUENCY
type mix appears to have at least temporarily stabilized over OF SNOWSPORTS PARTICIPATION
the most recent three seasons, suggesting that a new equilib- On an overall national basis, the average number of days respon-
rium might be developing (figure 6). dents anticipated they would downhill ski/snowboard during
the season trended down from 18.9 days in 2007-08 to 15.6 days
SHIFTING TRENDS IN ABILITY LEVEL in 2016-17. In addition, the average number of days respondents
From 1999-00 through 2012-13, the proportion of partic- anticipated they would downhill ski/snowboard at the resort at
ipants who are advanced/expert trended up steadily (from which they were interviewed has also trended down, from 12.3
37.7 percent to 45.1 percent), while the proportion who days in 2007-08 to 9.4 days in 2016-17. The reduction in skiing
are intermediates trended down (from 48.2 percent to 41.9 frequency is consistent with the recent trend (at least in the past
Figure 5. Index of Skier Visits Relative to Population, by State: 2016/17
222
222
222
258
253
258 253
258
253
50
610
610
50
50 610
176
176
214
214 176
214
395
395
395
273
387 273
387
273
387
127
127
87
87
87 127 145
145
145
263 120 142
142
263
142
263
120
120
307
212
307 212
307
212
28
28
28 90
90
90
120
120
39 120
39
39
67
67
135
135
135 54 67
54
54
65
65
30
30
109
109
399
399 65 30 109 65
399
65
65
26
26
109
109
619
619
109 619 26
64
64
64
57 35 24
57
57
35
35
24
24
39
39
39
30
30
30
35
35
27
27
27 35
18
18
110 18 26
110
26
26
110
29
29
20
20
13
13
13 20 29
36 39 23
36
36
23
23
39
39
Note: Skier visits as
of winter 2016/17.
33
33
33
Population as of July 1,
2016 (per U.S. Census).
EARLY WINTER 2017 | NSAA JOURNAL | 25