
Page 26 - 77834_NSAA_Batch
P. 26
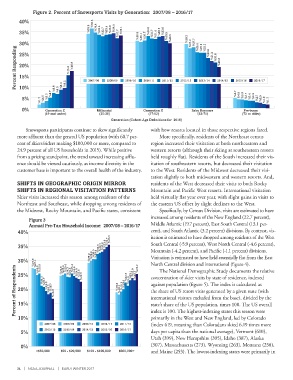
Figure 2. Percent of Snowsports Visits by Generation:  2007/08 – 2016/17
         40%                            %36.2
                                      %33.9  %34.4  %33.4  %33.4  %33.6  %34.0  %33.1
         35%                                %32.7  %31.7   %30.6  %30.1  %30.7  %32.8  %31.7  %31.4  %32.5  %32.8  %30.5  %29.5

         30%                                                                   %29.2  %27.2  %27.7  %25.4  %25.2  %25.2  %22.8
        Percent Responding  20%  %15.0  %16.9  2007/08  2008/09  2009/10  2010/11  2011/12  2012/13  2013/14  %21.4  %20.8  2014/15  2015/16  2016/17
         25%
                                                                                             %18.8


         15%

         10%
                      %4.7  %6.9  %6.5  %8.4  %9.2                                                  %4.7  %4.0  %3.9  %3.7
          5%      %1.7  %2.5  %3.3                                                                        %3.4  %3.4  %2.7  %2.5  %1.9  %1.7

          0%        Generation Z         Millennial          Generation X        Baby Boomers          Pre-boom
                    (19 and under)         (20-36)             (37-52)              (53-71)           (72 or older)
                                               Generation (Cohort Age Definitions for  2016)
            Snowsports participants continue to skew significantly   with how resorts located in those respective regions fared.
        more affluent than the general US population (with 60.7 per-  More specifically, residents of the Northeast census
        cent of skiers/riders making $100,000 or more, compared to   region increased their visitation at both northeastern and
        24.9 percent of all US households in 2015). While positive   western resorts (although their skiing at southeastern resorts
        from a pricing standpoint, the trend toward increasing afflu-  held roughly flat). Residents of the South increased their vis-
        ence should be viewed cautiously, as income diversity in the   itation of southeastern resorts, but decreased their visitation
        customer base is important to the overall health of the industry.  to the West. Residents of the Midwest decreased their visi-
                                                                tation slightly to both midwestern and western resorts. And,
        SHIFTS IN GEOGRAPHIC ORIGIN MIRROR                      residents of the West decreased their visits to both Rocky
        SHIFTS IN REGIONAL VISITATION PATTERNS                  Mountain and Pacific West resorts. International visitation
        Skier visits increased this season among residents of the   held virtually flat year over year, with slight gains in visits to
        Northeast and Southeast, while dropping among residents of   the eastern US offset by slight declines to the West.
        the Midwest, Rocky Mountain, and Pacific states, consistent   Specifically, by Census Division, visits are estimated to have
                                                                increased among residents of the New England (22.7 percent),
             Figure 3
             Annual Pre-Tax Household Income:  2007/08 – 2016/17  Middle Atlantic (19.7 percent), East South Central (13.1 per-
        40%                                    %35.5            cent), and South Atlantic (3.2 percent) divisions. By contrast, vis-
                                                                itation is estimated to have dropped among residents of the West

        35%                               %32.3  %32.7  %33.0  %33.9  %34.7  South Central (-5.9 percent), West North Central (-4.6 percent),
                                                                Mountain (-4.2 percent), and Pacific (-1.1 percent) divisions.
                                       %29.2  %29.9  %30.5  %30.4  Visitation is estimated to have held essentially flat from the East
        30%    %27.3  %27.1  %24.9  %25.9  %24.6  %25.0  %25.4  %24.3  %24.2  %25.4  %24.5  %24.0  %23.5  %23.1  %23.9  %23.1  %25.2  North Central division and international (figure 4).
       Percent of Respondents  20%  %21.2  %20.7  %19.3  %18.2  %18.7  %16.8  %22.5  %18.9  %18.1  %19.1  %19.9  %22.3  %21.1  concentration of skier visits by state of residence, indexed
                                                                    The National Demographic Study documents the relative
        25%

                                                                against population (figure 5). The index is calculated as
                                                                the share of US resort visits generated by a given state (with
                                                                international visitors excluded from the base), divided by the
        15%
                                                                state’s share of the US population, times 100. The US overall

        10%                                                     index is 100. The highest-indexing states this season were
                                                                primarily in the West and New England, led by Colorado
                    2007/08  2008/09  2009/10  2010/11  2011/12  (index 619, meaning than Coloradans skied 6.19 times more
                    2012/13  2013/14  2014/15  2015/16  2016/17
          5%                                                    days per capita than the national average), Vermont (610),
                                                                Utah (399), New Hampshire (395), Idaho (387), Alaska
          0%                                                    (307), Massachusetts (273), Wyoming (263), Montana (258),
                <$50,000  $50 - $99,999  $100 - $199,999  $200,000+  and Maine (253). The lowest-indexing states were primarily in


        24  | NSAA JOURNAL  |  EARLY WINTER 2017