
Page 19 - Legal Aid CRP EJ Toolkit
P. 19
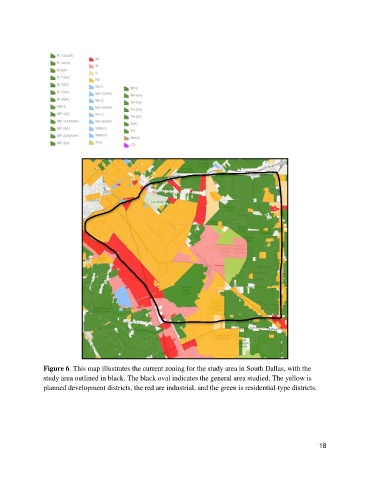
Figure 6. This map illustrates the current zoning for the study area in South Dallas, with the
               study area outlined in black. The black oval indicates the general area studied. The yellow is
               planned development districts, the red are industrial, and the green is residential-type districts.


                                                                                                           18