Page 180 - RFHL ANNUAL REPORT 2025 ONLINE_NEW
P. 180

178   •  Republic Financial Holdings Limited 2025 Annual Report  •  FINANCIALS


            Notes to the Consolidated Financial Statements

            For the year ended September 30, 2025. Expressed in millions of Trinidad and Tobago dollars, except where otherwise stated.


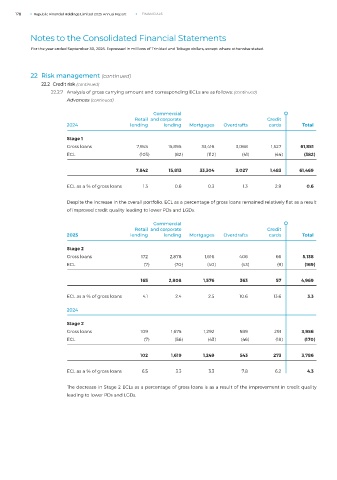
            22  Risk management (continued)
                22.2  Credit risk (continued)
                   22.2.7  Analysis of gross carrying amount and corresponding ECLs are as follows: (continued)
                         Advances (continued)
                                                       Commercial
                                                 Retail   and corporate                         Credit
                         2024                  lending     lending    Mortgages     Overdrafts     cards     Total

                         Stage 1
                         Gross loans              7,945      15,895      33,416      3,068       1,527      61,851
                         ECL                       (103)       (82)        (112)       (41)       (44)       (382)


                                                  7,842      15,813     33,304       3,027       1,483     61,469

                         ECL as a % of gross loans    1.3      0.6         0.3         1.3         2.9        0.6


                         Despite the increase in the overall portfolio, ECL as a percentage of gross loans remained relatively flat as a result
                         of improved credit quality leading to lower PDs and LGDs.

                                                       Commercial
                                                 Retail   and corporate                         Credit
                         2025                  lending     lending    Mortgages     Overdrafts     cards     Total

                         Stage 2
                         Gross loans               172       2,878        1,616       406          66       5,138
                         ECL                        (7)        (70)        (40)        (43)        (9)       (169)

                                                   165       2,808       1,576        363          57       4,969


                         ECL as a % of gross loans    4.1      2.4         2.5        10.6        13.6        3.3

                         2024

                         Stage 2
                         Gross loans               109        1,675      1,292        589         291       3,956
                         ECL                        (7)        (56)        (43)        (46)        (18)      (170)


                                                   102        1,619      1,249        543         273       3,786

                         ECL as a % of gross loans    6.5       3.3        3.3         7.8         6.2        4.3


                         The decrease in Stage 2 ECLs as a percentage of gross loans is as a result of the improvement in credit quality
                         leading to lower PDs and LGDs.
   175   176   177   178   179   180   181   182   183   184   185