
Page 34 - The World About Us
P. 34
Singapore
1.1.1
2.2.1
What are the strengths and weaknesses of using GNI?
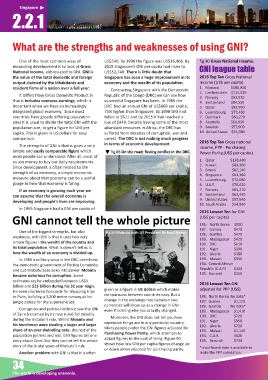
One of the most common ways of US$540. By 1990 the figure was US$16,466. By fig.90 Gross Na onal Income.
measuring development is to look at Gross 2015 Singapore’s GNI per capita had risen to GNI league table
Na onal Income, abbreviated to GNI. GNI is US$52,740. There is li le doubt that
the value of the total domes c and foreign Singapore has seen a huge improvement in its 2016 Top Ten Gross Na onal
output claimed by the inhabitants and economy and the wealth of its popula on. Income (US$ per capita)
resident firms of a na on over a full year. 1. Monaco $186,950
Contras ng Singapore with the Democra c
2. Liechtenstein $115,530
It differs from Gross Domes c Product in Republic of the Congo (DRC) we can see how
3. Norway $93,530
that it includes overseas earnings, which is successful Singapore has been. In 1965 the 4. Switzerland $84,550
important when we have an increasingly DRC had an annual GNI of US$968 per capita, 5. Qatar $83,990
integrated global economy. Since most 75% higher than Singapore. By 1990 GNI had 6. Luxembourg $77,480
countries have greatly differing popula on fallen to $611 and by 2015 it had reached a 7. Denmark $60,270
sizes it is usual to divide the total GNI with the low of $349. Despite having some of the most 8. Australia $60,050
popula on size, to get a figure for GNI per abundant resources in Africa, the DRC has 9. Sweden $57,900
capita. This is given in US dollars for easy suffered from decades of corrup on, war and 10. United States $55,980
comparison. unrest. The DRC is not making much progress 2016 Top Ten Gross na onal
The strengths of GNI is that is gives a very in terms of economic development. income, PPP - Purchasing
simple and easily comparable figure which fig.88 On the road; fleeing conflict in the DRC. Power Parity,(US$ per capita).
most people can understand. A er all, most of
us use money to buy our daily requirements. 1. Qatar $138,480
Since development is o en related to the 2. Kuwait $84,360
$82,140
3. Brunei
strength of an economy, a simple economic 4. Singapore $81,360
measure about that economy can be a useful 5. Luxembourg $72,080
gauge to how that economy is faring. 6. U.A.E. $70,020
If an economy is growing each year we 7. Norway $65,210
can assume that the overall economy is 8. Switzerland $63,990
9. United States $57,540
developing and people’s lives are improving.
10. Saudi Arabia $54,840
In 1965 Singapore had a GNI per capita of
2016 Lowest Ten for GNI
GNI cannot tell the whole picture (US$ per capita)
186. North Korea $500
187. Guinea $470
One of the biggest strengths, but also fig.89 Mobutu with US President Richard Nixon.
weakness, with GNI is that it uses two very 188. Gambia $470
189. Madagascar $420
simple figures - the wealth of the country and
190. DRC $410
its total popula on. What is doesn’t tell us is 191. Niger $390
how the wealth of an economy is divided up. 192. Liberia $380
In 1965 a military coup in the DRC overthrew 193. Malawi $350
the democra c government of Patrice Lumumba 194. Central African
and put Mobutu Sese Seko into power. Mobutu Republic (C.A.R) $320
became notorious for corrup on. Some 195. Burundi $260
es mates say he embezzled between US$4
2016 Lowest Ten GNI
billion and $15 billion during his 32 year reign.
He even chartered Concorde for shopping trips given as a figure in US dollars which makes adjusted for PPP (US$)
comparisons between countries easy. But a
to Paris, building a 3,200 metre runway at his 186. North Korea No data*
change in the exchange rate between two
jungle palace for the supersonic jet. 187. Guinea $1,120
currencies will show up as a change in GNI - 188. Gambia No data*
Corrup on and poli cal violence saw the GNI even if nothing else has actually changed. 189. Madagascar $1,410
of Zaire (renamed by its new ruler) fall steadily 190. DRC $720
during the dictator’s rule. Whilst Mobuto and Moreover, the GNI does not tell you how 191. Niger $950
his henchmen were stealing a larger and larger expensive things are in any par cular country. 192. Liberia $720
Many people prefer the GNI figures adjusted for
share of an ever-dwindling cake, the rest of the 193. Malawi $1,140
Purchasing Power Parity, which a empts to
popula on got less and less. GNI figures tell one 194. C.A.R. $620
story about Zaire, but they cannot tell the whole adjust figures to the cost of living. Figure 90 195. Burundi $730
shows how raw GNI per capita figures change up
story of the brutal years of Mobutu’s rule.
or down when adjusted for purchasing parity. * insufficient data is available to
Another problem with GNI is that it is o en make the PPP calculation.
34
The world is developing unevenly.