
Page 35 - The World About Us
P. 35
Sheffield crowd
2.2.1
What is the Human Development Index?
As we saw on page 34 there are
many different indicators of
development. Despite its weaknesses
Gross Na onal Income (GNI) per capita
is s ll one of the most common ways
people use to measure development.
However, in the 1980s there was an
a empt by many working in human
development to “shi the focus of
development economics from na onal
income accoun ng to people-centred
policies.” In response, Pakistani
economist Muhbub ul Haq, along with
other economists such as the Indian
Amartya Sen, devised the Human
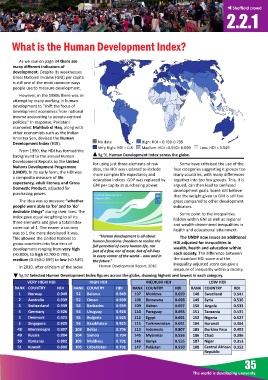
Development Index (HDI). No data High: HDI = 0.700-0.799
Very High: HDI > 0.8 Medium: HDI =0.550> 0.699 Low: HDI < 0.549
From 1990, the HDI has formed the
background to the annual Human fig.91 Human Development Index across the globe.
Development Reports by the United for using just three elements of raw Some have cri cised the use of the
Na ons Development Programme data, the HDI was updated to include four categories sugges ng it groups too
(UNDP). In its early form, the HDI was more complex life expectancy and many countries, with many differences
a composite measure of life
educa on indices. GDP was replaced by together into too few groups. This, it is
expectancy, adult literacy and Gross
GNI per capita at purchasing power. argued, can then lead to confused
Domes c Product, adjusted for development goals. Some s ll believe
purchasing power.
that the weight given to GNI is s ll too
The idea was to measure “whether great compared to other development
people were able to 'be' and to 'do' indicators.
desirable things” during their lives. The Some point to the inequali es
index gave equal weigh ng to all its hidden within GNI as well as regional
three elements and gave a total index and wealth-determined inequali es in
score out of 1. The nearer a country
health and educa onal a ainment.
was to 1 the more developed it was.
This allowed the United Na ons to “Human development is all about The UNDP now issues an addi onal
group countries into four ers of human freedoms: freedom to realize the HDI adjusted for inequali es in
full poten al of every human life, not
development ranging from very high just of a few, nor of most, but of all lives wealth, health and educa on within
(>0.800), to high (0.700-0.799), each society. The difference between
in every corner of the world—now and in
medium (0.550-0.699) to low (<0.549). the future.” the standard HDI score and the
In 2010, a er cri cism of the Index Human Development Report, 2016 inequality adjusted score can give a
measure of inequality within a society.
fig.92 Selected Human Development Index figures across the globe, showing highest and lowest in each category.
VERY HIGH HDI HIGH HDI MEDIUM HDI LOW HDI
RANK COUNTRY HDI RANK COUNTRY HDI RANK COUNTRY HDI RANK COUNTRY HDI
1 Norway 0.949 52 Belarus 0.949 107 Moldova 0.699 148 Swaziland 0.541
2 Australia 0.939 52 Oman 0.939 108 Botswana 0.698 149 Syria 0.536
3 Switzerland 0.939 54 Barbados 0.939 109 Gabon 0.697 150 Angola 0.533
4 Germany 0.926 54 Uruguay 0.926 110 Paraguay 0.693 151 Tanzania 0.531
5 Denmark 0.925 56 Bulgaria 0.925 111 Egypt 0.691 152 Nigeria 0.527
5 Singapore 0.925 56 Kazakhstan 0.925 111 Turkmenistan 0.691 184 Burundi 0.404
48 Montenegro 0.807 103 Belize 0.706 113 Indonesia 0.807 185 Burkina Faso 0.402
49 Russia 0.804 104 Samoa 0.704 145 Myanmar 0.556 186 Chad 0.396
50 Romania 0.802 105 Maldives 0.701 146 Kenya 0.555 187 Niger 0.353
51 Kuwait 0.800 105 Uzbekistan 0.701 147 Pakistan 0.550 188 Central African 0.352
Republic
35
The world is developing unevenly.