
Page 37 - The World About Us
P. 37
Laos labourers
1.1.1
2.2.1
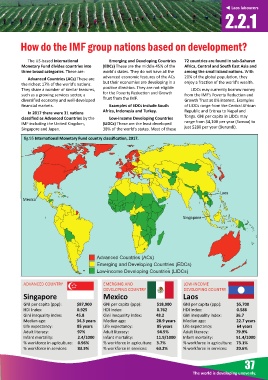
How do the IMF group nations based on development?
The US-based Interna onal Emerging and Developing Countries 72 countries are found in sub-Saharan
Monetary Fund divides countries into (EDCs) These are the middle 45% of the Africa, Central and South East Asia and
three broad categories. These are: world's states. They do not have all the among the small island na ons. With
advanced economic features of the ACs 20% of the global popula on, they
Advanced Countries (ACs) These are
the richest 17% of the world's na ons. but their economies are developing in a enjoy a frac on of the world's wealth.
They share a number of similar features, posi ve direc on. They are not eligible LIDCs may currently borrow money
such as a growing services sector, a for the Poverty Reduc on and Growth from the IMF’s Poverty Reduc on and
diversified economy and well-developed Trust from the IMF. Growth Trust at 0% interest. Examples
financial markets. Examples of EDCs include South of LIDCs range from the Central African
Africa, Indonesia and Turkey. Republic and Eritrea to Nepal and
In 2017 there were 31 na ons
classified as Advanced Countries by the Low-income Developing Countries Tonga. GNI per capita in LIDCs may
IMF including the United Kingdom, (LIDCs) These are the least developed range from $4,100 per year (Samoa) to
Singapore and Japan. 38% of the world's states. Most of these just $280 per year (Burundi).
fig.95 Interna onal Monetary Fund country classifica on, 2017.
Laos
Mexico
Singapore
Advanced Countries (ACs)
Emerging and Developing Countries (EDCs)
Low-income Developing Countries (LIDCs)
ADVANCED COUNTRY EMERGING AND LOW-INCOME
DEVELOPING COUNTRY DEVELOPING COUNTRY
Singapore Mexico Laos
GNI per capita (ppp): $87,900 GNI per capita (ppp): $18,900 GNI per capita (ppp): $5,700
HDI Index: 0.925 HDI Index: 0.762 HDI Index: 0.586
Gini inequality index: 45.8 Gini inequality index: 48.2 Gini inequality index: 36.7
Median age: 34.3 years Median age: 28.9 years Median age: 22.7 years
Life expectancy: 85 years Life expectancy: 85 years Life expectancy: 64 years
Adult literacy: 97% Adult literacy: 94.5% Adult literacy: 79.9%
Infant mortality: 2.4/1000 Infant mortality: 11.9/1000 Infant mortality: 51.4/1000
% workforce in agriculture: 0.96% % workforce in agriculture: 3.7% % workforce in agriculture: 73.1%
% workforce in services: 83.5% % workforce in services: 63.2% % workforce in services: 20.6%
37
The world is developing unevenly.