
Page 28 - ASBIRES-2017_Preceedings
P. 28
A STUDY ON FACTORS AFFECTING THE QUALITY STATUS OF EMPLOYEES IN AN IT COMPANY
catogories B and C. To observe the 5 RESULTS AND DISCUSSION
association between personal factors and
the quality of the products, Perason’s Chi- The following Table 1 illustrates the
Square test was conducted. As the core Cronbach’s Alpha Value Test for the
objective of the study was to identify factors reliability of the questionnaire. As the
that affect on employee quality, quality Cronbach’s alpha value is 0.797 > 0.7, we
status of the employee was taken as the could conclude that the questionnaire was
dependent variable. Binary Logistic reliable.
regression model was suited for this data as Table 1: Cronbach’s Alpha test
dependent variable was binary(catogory C Cronbach's Cronbach's Alpha No of
or not). Therefore Binary Logistic Alpha based on Items
Regression model was fited to data to standardized items
idenfity factors that significantly impact on .797 .431 16
status of worker’s quality.
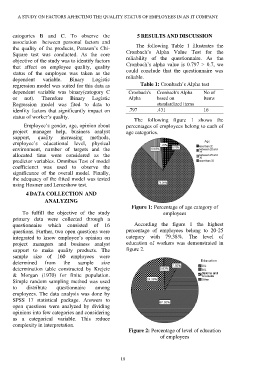
The following figure 1 shows the
Employee’s gender, age, opinion about percentages of employees belong to each of
project manager help, business analyst age categories.
support, quality increasing methods,
employee’s educational level, physical
environment, number of targets and the
allocated time were considered as the
predictor variables. Omnibus Test of model
coefficienct was used to observe the
significance of the overall model. Finally,
the adequacy of the fitted model was tested
using Hosmer and Lemeshow test.
4 DATA COLLECTION AND
ANALYZING
Figure 1: Percentage of age category of
To fulfill the objective of the study employees
primary data were collected through a
questionnaire which consisted of 16 According the figure 1 the highest
questions. Further, two open questions were percentage of employees belong to 20-25
integrated to know employee’s opinion on category with 79.38%. The level of
project managers and business analyst education of workers was demonstrated in
support to make quality products. The figure 2.
sample size of 160 employees were
determined from the sample size
determination table constructed by Krejcie
& Morgan (1970) for finite population.
Simple random sampling method was used
to distribute questionnaire among
employees. The data analysis was done by
SPSS 17 statistical package. Answers to
open questions were analyzed by dividing
opinions into few categories and considering
as a categorical variable. This reduce
complexity in interpretation.
Figure 2: Percentage of level of education
of employees
18