
Page 23 - ASBIRES-2017_Preceedings
P. 23
Kaushalya & Appuhamy
The response to each attitudinal
question in questionnaire was measured on a Knocked 23%
five point Likert Scale, under categories of Cut Injury 17%
‘strongly agree ’, ‘agree’, ‘neither agree nor Fall 17%
disagree’, ‘disagree’, and ‘strongly Trimmer Cut 11%
disagree’. Respondents were invited to Needle… 9%
discriminate favorably or unfavorably Trimmer… 8% Number of
Accidents
against the statement of opinion. The Burn 7%
attitudinal statements were assessed by Manual… 5%
giving a score, 5 to those who strongly agree Eye 2%
with the statement, 4 to those who agree Moving… 1%
with the statement, 3 to those who neither
agree nor disagree with the statement, 2 to 0 10 20 30
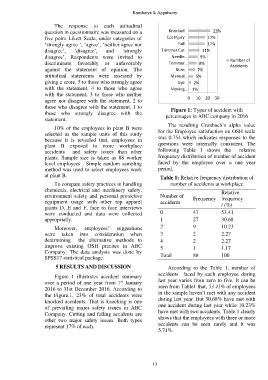
those who disagree with the statement, 1 to Figure 1: Types of accident with
those who strongly disagree with the percentages in ABC company in 2016
statement.
The resulting Cronbach’s alpha value
10% of the employees in plant B were
selected as the sample units of this study for the Employee satisfaction on OSH scale
because it is revealed that, employees in was 0.754 which indicates responses to the
plant B exposed to more workplace questions were internally consistent. The
accidents and safety issues than other following Table 1 shows the relative
plants. Sample size is taken as 88 worker frequency distribution of number of accident
level employees . Simple random sampling faced by the employee over a one year
method was used to select employees work period.
at plant B. Table 1: Relative frequency distribution of
To compare safety practices in handling number of accidents at workplace
chemicals, electrical and machinery safety, Relative
environment safety and personal protective Number of Frequency frequency
equipment usage with other top apparel accidents
giants D, E and F, face to face interviews / (%)
were conducted and data were collected 0 47 53.41
appropriatly. 1 27 30.68
Moreover, employees’ suggestions 2 9 10.23
were taken into consideration when 3 2 2.27
determining the alternative methods to 4 2 2.27
improve existing OSH pracites in ABC 5 1 1.17
Company. The data analysis was done by
SPSS17 statistical package. Total 88 100
5 RESULTS AND DISCUSSION According to the Table 1, number of
accidents faced by each employee during
Figure 1 illustrates accident summary
st
over a period of one year from 1 January last year varies from zero to five. It can be
2016 to 31st December 2016. According to seen from Table1 that, 53.41% of employees
the Figure.1, 23% of total accidents were in the sample haven’t met with any accident
knocked accidents. That is knocking is one during last year. But 30.68% have met with
of prevailing major safety issues in ABC one accident during last year while 10.23%
Company. Cutting and falling accidents are have met with two accidents. Table 1 clearly
other two major safety issues. Both types shows that the employees with three or more
represent 17% of each. accidents can be seen rarely and it was
5.71%.
13