
Page 29 - ASBIRES-2017_Preceedings
P. 29
Dayarathne, Ekanayake & Appuhamy
According to the figure 2, 67.5% of significantly associated with their quality
employees have passed GCE A/L exam. status whereas education and experience
Moreover, the experience of current were not.
employees was summarized in below figure Table 3 shows the Omnibus Test for the
3. Model Coefficients. The corresponding
hypotheses are mentioned below.
H0: The model is not significant
H1: The model is significant
As shown in Table 3, P value is 0.003 <
0.05. Therefore, reject H0 at 5% level of
significance. This concludes the overall
model is significant at 5% level of
significance.
Table 3: Omnibus test for the model
coefficients
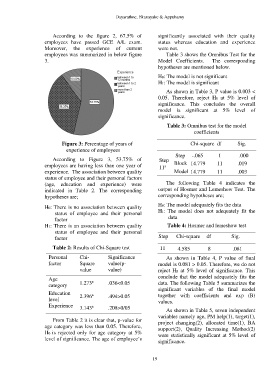
Figure 3: Percentage of years of Chi-square df Sig.
experience of employees
Step -.065 1 .000
According to Figure 3, 53.75% of Step
employees are having less than one year of 11 Block 14.779 11 .019
a
experience. The association between quality Model 14.779 11 .003
status of employee and their personal factors
(age, education and experience) were The following Table 4 indicates the
indicated in Table 2. The corresponding output of Hosmer and Lemeshow Test. The
hypotheses are; corresponding hypotheses are;
H0: There is no association between quality H0: The model adequately fits the data
status of employee and their personal H1: The model does not adequately fit the
factor data
H1: There is an association between quality Table 4: Hosmer and lemeshow test
status of employee and their personal
factor Step Chi-square df Sig.
Table 2: Results of Chi-Square test 11 4.585 8 .081
Personal Chi- Significance As shown in Table 4, P value of final
factor Square value(p- model is 0.081 > 0.05. Therefore, we do not
value value) reject H0 at 5% level of significance. This
Age a conclude that the model adequately fits the
category 1.273 .036<0.05 data. The following Table 5 summarizes the
significant variables of the final model
Education 2.396 .494>0.05 together with coefficients and exp (B)
a
level values.
Experience 3.143 .208>0/05
a
As shown in Table 5, seven independent
variables namely age, PM help(1), target(1),
From Table 2 it is clear that, p-value for project changing(2), allocated time(1), BA
age category was less than 0.05. Therefore, support(2), Quality Increasing Method(2)
H0 is rejected only for age category at 5% were statistically significant at 5% level of
level of significance. The age of employee’s
significance.
19