
Page 77 - Complete IELTS Bands 5 - 6.5
P. 77
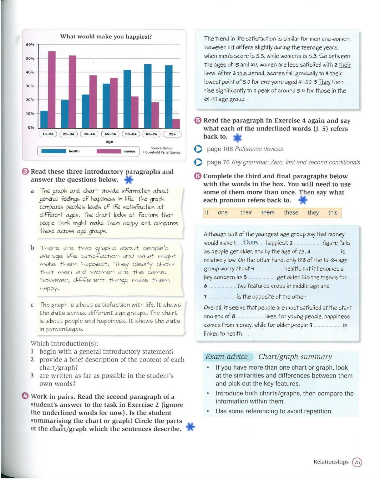
What would make you happiest?
                                                                The trend in life satisfaction is similar for men and women.
         60%
                                                                1-towever. 1 it differs slight ly during the teenage years.
                                                                when men's score is 5.5, while women's is 5 . .3. So between
         50%
                                                                the ages of 15 and 20, women are less satisfied with 2 their
         40%                                                    lives. After 3 this period. scores fall gradually to q their
                                                                lowest point of 5 .0 for everyone aged 41- 50. 5 They then
         30%
                                                                rise significantly to a peak of around s.o for those in the
         20%                                                    101-70 age group.

         10%
                                                             0  Read the paragraph in Exercise 4 again and say
          0%                                                    what each of the underlined words (1-5) refers
             (  15-24 )  (  25- 34 )  (  35-44 )  (  45 - 54 )  (  55- 64 )  (  65- 74 )  ~
                                                                back to.
                                  age
                                                             0  page 106 Reference devices
             ~        health           money    Source: British
             ~~~~~~=J~~~~~~)  Household Panel Survey
                                                             0  page 76 Key grammar: Zero,  first and second conditionals
        €) Read these three introductory paragraphs and
                                                             0  Complete the third and final paragraphs below
          answer the questions below.
                                                                with the words in the box. You will need to use
          a  ~ _gra.ph  a.nd.  cho..rt  proVici.e  ,nformo..tion  a.bou.t   some of them more than once. Then say what
             _genera.!  feeliY!9S  of ho..pp·,n€ss  in  life.  The _gra.ph   each pronoun refers back to.
             compa.res  people's  levels  of life  sa.tisfa.dion a.t
                                                                 it   one   their   them   these   they   this
             different a._ges.  ~ cho..rt  looks  a.t  fa.ctors  tho..t
             people  t hink  m!ght  mo..ke  them  ho..ppy  a.nd.  compa.res
             t hese a.cross  a._ge _grou.ps.
                                                                Although 55% of t he youngest age group say t hat money
                                                                would make I ... . .th.~~- ... happiest. 2  ... . .. . . ......  . . figure falls
          b  lhel"e  c:we  t·vvo  gl"cphs  abo ut  people 's
                                                                as people get older. and by the age of 75 . 3  ..  . ..... ...... is
             cVel"cge  \.-9e  satis-9cc tion  and  \what  rY~ight
                                                                relatively low. On the other hand, only 12% of the 15-24 age
             rY~cke therY~ happiest.  lhey  c\eal"\y  s h o \tJ
                                                                group worry about q .   ..  health. but it becomes a
             that  rY~en  and  \WOrY~en al"e  the  ScrY~e.
             1-\o \tJeVel",  di-9-9el"ent  things  rY~cke therY~   key concern as 5    get older. S o t he trends for
                                                                6     .......... two features cross in middle age and
             h appy.
                                                                7  .   . . . .  is t he opposite of the other.
          c  The graph is about satisfaction wit h life. It shows
                                                                Overall. it seems t hat people are most satisfied at the start
             t he data across different age groups. The chart
                                                                and end of 8  ................ lives. for young people, happiness
             is about people and happiness. It shows t he data
                                                                comes from money. while for older people q   . ..  lS
             in percent ages.
                                                                linked to health.
          Which introduction (s):
           1  begin with a general introductory statement?
          2  provide a brief description of the content of each   Exam advice    Chart/graph summary
             chart/graph?                                           If you have more than one chart or graph, look
          3  are written as far as possible in the student's        at the similarities and differences between them
             own words?                                             and pick out the key features.
                                                                    Introduce both charts/graphs, then compare the
        0  Work in pairs. Read the second paragraph of a
                                                                    information within them.
          student's answer to the task in Exercise 2 (ignore
          the underlined words for now). Is the student             Use some referencing to avoid  repetition.
          summarising the chart or graph? Circle the parts
          of the cha~t/graph which the sentences describe.


                                                                                                  Relationships @