
Page 105 - Feed Lab
P. 105
Estimation of Peroxide Value in Oil and Tallow Suguna Management System Ver 1.0 / SOP / FQL / P2 - 22 Page 2 of 2
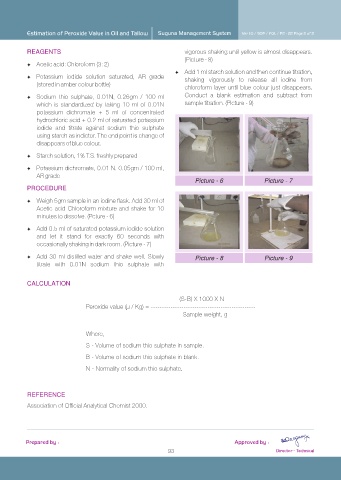
vigorous shaking until yellow is almost disappears.
REAGENTS
(Picture - 8)
FAcetic acid: Chloroform (3: 2)
FAdd 1 ml starch solution and then continue titration,
FPotassium iodide solution saturated, AR grade shaking vigorously to release all iodine from
(stored in amber colour bottle)
chloroform layer until blue colour just disappears.
FSodium thio sulphate, 0.01N, 0.26gm / 100 ml Conduct a blank estimation and subtract from
which is standardized by taking 10 ml of 0.01N sample titration. (Picture - 9)
potassium dichromate + 5 ml of concentrated
hydrochloric acid + 0.2 ml of saturated potassium
iodide and titrate against sodium thio sulphate
using starch as indictor. The end point is change of
disappears of blue colour.
FStarch solution, 1% T.S. freshly prepared
FPotassium dichromate, 0.01 N. 0.05gm / 100 ml,
AR grade
Picture - 6 Picture - 7
PROCEDURE
FWeigh 5gm sample in an iodine flask. Add 30 ml of
Acetic acid Chloroform mixture and shake for 10
minutes to dissolve. (Pcture - 6)
FAdd 0.5 ml of saturated potassium iodide solution
and let it stand for exactly 60 seconds with
occasionally shaking in dark room. (Picture - 7)
FAdd 30 ml distilled water and shake well. Slowly
Picture - 8 Picture - 9
titrate with 0.01N sodium thio sulphate with
CALCULATION
(S-B) X 1000 X N
Peroxide value (µ / Kg) = ------------------------------------------------
Sample weight, g
Where,
S - Volume of sodium thio sulphate in sample.
B - Volume of sodium thio sulphate in blank.
N - Normality of sodium thio sulphate.
REFERENCE
Association of Official Analytical Chemist 2000.
Prepared by : Approved by :
93 Director - Technical