
Page 77 - Technology Roadmap Transportation
P. 77
TECHNOLOGY ROADMAP: TRANSPORTATION
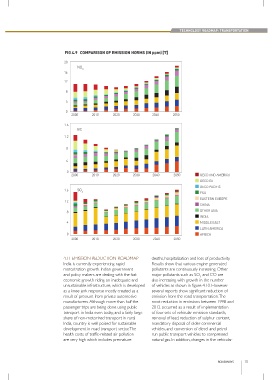
FIG 4.9 COMPARISON OF EMISSION NORMS (IN ppm) [7]
20
NO
X
16
12
8
4
0
2000 2010 2020 2030 2040 2050
1.6
BC
1.2
8
4
0
2000 2010 2020 2030 2040 2050 OECD AND AMERICA
OECD EU
OECD PACIFIC
1.6 SO
2 FSU
EASTERN EUROPE
12
CHINA
8 OTHER ASIA
INDIA
4 MIDDLE EAST
LATIN AMERICA
0 AFRICA
2000 2010 2020 2030 2040 2050
4.11 EMISSION REDUCTION ROADMAP deaths, hospitalization and loss of productivity.
India is currently experiencing rapid Results show that various engine generated
motorization growth. Indian government pollutants are continuously increasing. Other
and policy makers are dealing with the fast major pollutants such as SO and CO are
2
economic growth riding on inadequate and also increasing with growth in the number
unsustainable infrastructure, which is developed of vehicles as shown in figure 4.10. However
as a knee-jerk response mostly created as a several reports show significant reduction of
result of pressure from private automotive emission from the road transportation. The
manufacturers. Although more than half the most reduction in emissions between 1998 and
passenger trips are being done using public 2012 occurred as a result of implementation
transport in India even today, and a fairly large of four sets of vehicular emission standards,
share of non-motorized transport in rural removal of lead, reduction of sulphur content,
India, country is well poised for sustainable mandatory disposal of older commercial
development in road transport sector. The vehicles, and conversion of diesel and petrol
health costs of traffic-related air pollution run public transport vehicles to compressed
are very high which includes premature natural gas. In addition, changes in the vehicular
ROADWAYS 75