
Page 13 - CBAC Newsletter 2015
P. 13
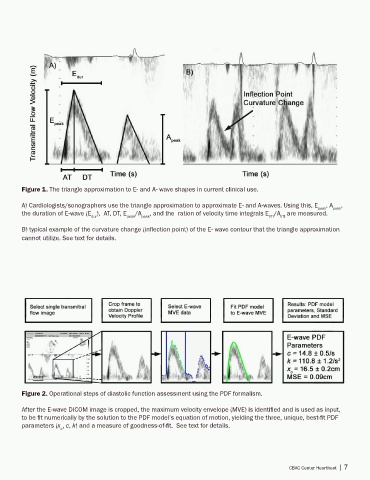
Figure 1. The triangle approximation to E- and A- wave shapes in current clinical use.


        A) Cardiologists/sonographers use the triangle approximation to approximate E- and A-waves. Using this, E peak , A peak ,
        the duration of E-wave (E ),  AT, DT, E  /A  , and the  ration of velocity time integrals E /A  are measured.
                               dur         peak  peak                                     VTI  VTI
        B) typical example of the curvature change (inflection point) of the E- wave contour that the triangle approximation
        cannot utilize. See text for details.


        Figure 2. Operational steps of diastolic function assessment using the PDF formalism.


        After the E-wave DICOM image is cropped, the maximum velocity envelope (MVE) is identified and is used as input,
        to be fit numerically by the solution to the PDF model’s equation of motion, yielding the three, unique, best-fit PDF
        parameters (x , c, k) and a measure of goodness-of-fit.  See text for details.
                     o


                                                                                                 CBAC Center Heartbeat | 7