
Page 14 - CBAC Newsletter 2015
P. 14
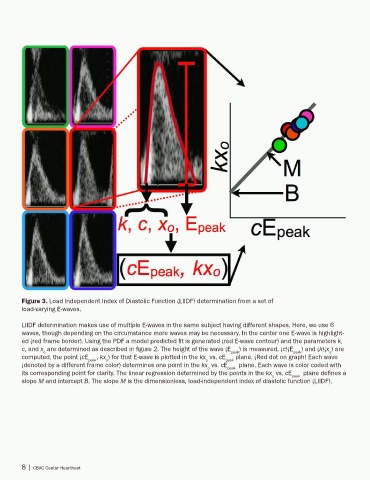
Figure 3. Load Independent Index of Diastolic Function (LIIDF) determination from a set of
        load-varying E-waves.

        LIIDF determination makes use of multiple E-waves in the same subject having different shapes. Here, we use 6
        waves, though depending on the circumstance more waves may be necessary. In the center one E-wave is highlight-
        ed (red frame border). Using the PDF a model predicted fit is generated (red E-wave contour) and the parameters k,
        c, and x  are determined as described in figure 2. The height of the wave (E peak ) is measured, (c)(E peak ) and (k)(x ) are
                                                                                                              o
               o
        computed, the point (cE peak , kx ) for that E-wave is plotted in the kx  vs. cE peak  plane. (Red dot on graph) Each wave
                                    o
                                                                     o
        (denoted by a different frame color) determines one point in the kx  vs. cE peak   plane. Each wave is color coded with
                                                                      o
        its corresponding point for clarity. The linear regression determined by the points in the kx  vs. cE peak   plane defines a
                                                                                           o
        slope M and intercept B. The slope M is the dimensionless, load-independent index of diastolic function (LIIDF).


        8 | CBAC Center Heartbeat