
Page 15 - CBAC Newsletter 2015
P. 15
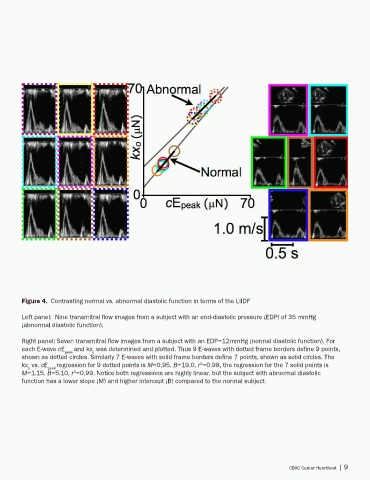
Figure 4.  Contrasting normal vs. abnormal diastolic function in terms of the LIIDF

        Left panel:  Nine transmitral flow images from a subject with an end-diastolic pressure (EDP) of 35 mmHg
        (abnormal diastolic function).


        Right panel: Seven transmitral flow images from a subject with an EDP=12mmHg (normal diastolic function). For
        each E-wave cE peak  and kx  was determined and plotted. Thus 9 E-waves with dotted frame borders define 9 points,
                                o
        shown as dotted circles. Similarly 7 E-waves with solid frame borders define 7 points, shown as solid circles. The
        kx  vs. cE peak  regression for 9 dotted points is M=0.95, B=19.0, r =0.98, the regression for the 7 solid points is
                                                                   2
          o
        M=1.15, B=5.10, r =0.99. Notice both regressions are highly linear, but the subject with abnormal diastolic
                         2
        function has a lower slope (M) and higher intercept (B) compared to the normal subject.


                                                                                                 CBAC Center Heartbeat | 9