
Page 106 - Live-cellanalysis handbook
P. 106
Live-Cell Analysis Handbook — Third Edition
Real-time quantification of neurite outgrowth in co-culture models
To identify and measure neuronal processes in co-cultures NeuroLight Orange, exposing the cells to lentivirus (MOI 1) for
containing neurons and astrocytes, incorporation of a neuronal- 16-24 h. After the incubation period, the lentivirus was removed
specific fluorescent label is required. Figure 3 shows primary rat and media replaced followed by addition of astrocytes. The
cortical neurons labeled with IncuCyte® NeuroLight Orange in co- microtiter plate was placed in an IncuCyte live-cell analysis system,
culture with rat primary astrocytes to measure changes in neurite where phase and fluorescent images (4 images per well, 20x) were
length over time. Rat cortical neurons were seeded in a 96-well captured every 6 h for the entire assay duration and automatic
poly-D-lysine coated micro-titer plate and allowed to adhere for 4 analysis of fluorescent images was performed to identify both cell
hours in an incubator. Neurons were then infected with IncuCyte body clusters and neurite length.
A B C
D Neurite length
2
(mm/mm )
200
150
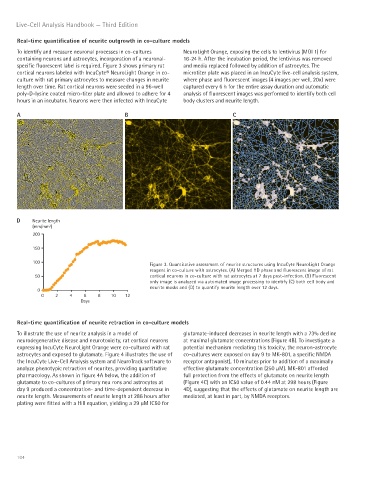
100 Figure 3. Quantitative assessment of neurite structures using IncuCyte NeuroLight Orange
reagent in co-culture with astrocytes. (A) Merged HD phase and fluorescent image of rat
50 cortical neurons in co-culture with rat astrocytes at 7 days post-infection. (B) Fluorescent
only image is analyzed via automated image processing to identify (C) both cell body and
neurite masks and (D) to quantify neurite length over 12 days.
0
0 2 4 6 8 10 12
Days
Real-time quantification of neurite retraction in co-culture models
To illustrate the use of neurite analysis in a model of glutamate-induced decreases in neurite length with a 73% decline
neurodegenerative disease and neurotoxicity, rat cortical neurons at maximal glutamate concentrations (Figure 4B). To investigate a
expressing IncuCyte NeuroLight Orange were co-cultured with rat potential mechanism mediating this toxicity, the neuron-astrocyte
astrocytes and exposed to glutamate. Figure 4 illustrates the use of co-cultures were exposed on day 9 to MK-801, a specific NMDA
the IncuCyte Live-Cell Analysis system and NeuroTrack software to receptor antagonist), 10 minutes prior to addition of a maximally
analyze phenotypic retraction of neurites, providing quantitative effective glutamate concentration (250 μM). MK-801 afforded
pharmacology. As shown in figure 4A below, the addition of full protection from the effects of glutamate on neurite length
glutamate to co-cultures of primary neu rons and astrocytes at (Figure 4C) with an IC50 value of 0.44 nM at 298 hours (Figure
day 9 produced a concentration- and time-dependent decrease in 4D), suggesting that the effects of glutamate on neurite length are
neurite length. Measurements of neurite length at 286 hours after mediated, at least in part, by NMDA receptors.
plating were fitted with a Hill equation, yielding a 29 μM IC50 for
104