Page 107 - Live-cellanalysis handbook
P. 107

Kinetic Neurite Analysis Assays


                                             A  Neurite length                       B  Neurite length
                                                (mm/mm )                               (mm/mm ) 2
                                                     2
                                                200                                    200
                                                150                            333 µM  150
                                                                               111 µM                   IC 29 µM
                                                                                                         50
                                                                               37 µM
                                                100                            12 µM   100
                                                                               4 µM
                                                                               1.4 µM
                                                 50                            Vehicle  50
                                                 0                                       0
                                                   0      100     200    300             -7    -6   -5    -4   -3    -2
                                                            Time (h)                                 Time (h)
                                             C  Neurite length                        D  Neurite length
                                                (mm/mm )                                 (mm/mm )
                                                     2
                                                                                              2
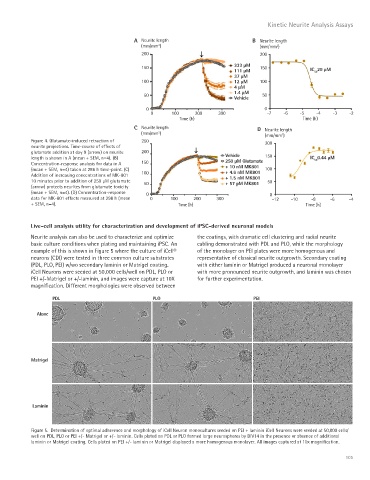
           Figure 4. Glutamate-induced retraction of   250                               200
           neurite projections. Time-course of effects of
           glutamate addition at day 9 (arrow) on neurite   200             Vehicle
           length is shown in A (mean + SEM, n=4). (B)                                   150            IC 0.44 µM
                                                                                                         50
           Concentration-response analysis for data in A   150              250 µM Glutamate
                                                                            + 10 nM MK801
           (mean + SEM, n=4) taken at 286 h time-point. (C)                 + 4.6 nM MK801  100
           Addition of increasing concentrations of MK-801   100            + 1.5 nM MK801
           10 minutes prior to addition of 250 μM glutamate   50            + 57 pM MK801  50
           (arrow) protects neurites from glutamate toxicity
           (mean + SEM, n=4). (D) Concentration-response   0                              0
           data for MK-801 effects measured at 298 h (mean   0  100  200  300              -12   -10    -8    -6     -4
           + SEM, n=4).                                     Time (h)                                  Time (h)

           Live-cell analysis utility for characterization and development of iPSC-derived neuronal models
           Neurite analysis can also be used to characterize and optimize   the coatings, with dramatic cell clustering and radial neurite
           basic culture conditions when plating and maintaining iPSC. An   cabling demonstrated with PDL and PLO, while the morphology
           example of this is shown in Figure 5 where the culture of iCell®   of the monolayer on PEI plates were more homogenous and
           neurons (CDI) were tested in three common culture substrates   representative of classical neurite outgrowth. Secondary coating
           (PDL, PLO, PEI) w/wo secondary laminin or Matrigel coating.    with either laminin or Matrigel produced a neuronal monolayer
           iCell Neurons were seeded at 50,000 cells/well on PDL, PLO or   with more pronounced neurite outgrowth, and laminin was chosen
           PEI +/-Matrigel or +/-laminin, and images were capture at 10X   for further experimentation.
           magnification. Different morphologies were observed between

                  PDL                               PLO                              PEI

             Alone


           Matrigel


            Laminin


           Figure 5.  Determination of optimal adherence and morphology of iCell Neuron monocultures seeded on PEI + laminin iCell Neurons were seeded at 50,000 cells/
           well on PDL, PLO or PEI +/- Matrigel or +/- laminin. Cells plated on PDL or PLO formed large neurospheres by DIV14 in the presence or absence of additional
           laminin or Matrigel coating. Cells plated on PEI +/- laminin or Matrigel displayed a more homogenous monolayer. All images captured at 10x magnification.


                                                                                                                   105
   102   103   104   105   106   107   108   109   110   111   112