
Page 425 - Adams and Stashak's Lameness in Horses, 7th Edition
P. 425
Diagnostic Imaging 391
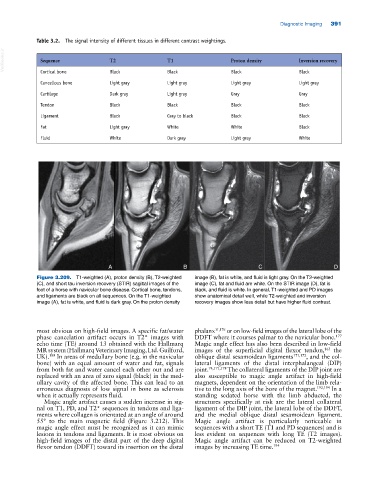
Table 3.2. The signal intensity of different tissues in different contrast weightings.
VetBooks.ir Sequence T2 T1 Proton density Inversion recovery
Black
Cortical bone
Black
Black
Black
Cancellous bone Light gray Light gray Light gray Light gray
Cartilage Dark gray Light gray Gray Gray
Tendon Black Black Black Black
Ligament Black Gray to black Black Black
Fat Light gray White White Black
Fluid White Dark gray Light gray White
A B C D
Figure 3.209. T1‐weighted (A), proton density (B), T2‐weighted image (B), fat is white, and fluid is light gray. On the T2‐weighted
(C), and short tau inversion recovery (STIR) sagittal images of the image (C), fat and fluid are white. On the STIR image (D), fat is
foot of a horse with navicular bone disease. Cortical bone, tendons, black, and fluid is white. In general, T1‐weighted and PD images
and ligaments are black on all sequences. On the T1‐weighted show anatomical detail well, while T2‐weighted and inversion
image (A), fat is white, and fluid is dark gray. On the proton density recovery images show less detail but have higher fluid contrast.
most obvious on high‐field images. A specific fat/water phalanx 31,176 or on low‐field images of the lateral lobe of the
phase cancelation artifact occurs in T2* images with DDFT where it courses palmar to the navicular bone.
177
echo time (TE) around 13 obtained with the Hallmarq Magic angle effect has also been described in low‐field
MR system (Hallmarq Veterinary Imaging, Ltd. Guilford, images of the superficial digital flexor tendon, the
163
UK). In areas of medullary bone (e.g. in the navicular oblique distal sesamoidean ligaments 171,172 , and the col
189
bone) with an equal amount of water and fat, signals lateral ligaments of the distal interphalangeal (DIP)
from both fat and water cancel each other out and are joint. 74,171,178 The collateral ligaments of the DIP joint are
replaced with an area of zero signal (black) in the med also susceptible to magic angle artifact in high‐field
ullary cavity of the affected bone. This can lead to an magnets, dependent on the orientation of the limb rela
erroneous diagnosis of low signal in bone as sclerosis tive to the long axis of the bore of the magnet. 192,194 In a
when it actually represents fluid. standing sedated horse with the limb abducted, the
Magic angle artifact causes a sudden increase in sig structures specifically at risk are the lateral collateral
nal on T1, PD, and T2* sequences in tendons and liga ligament of the DIP joint, the lateral lobe of the DDFT,
ments where collagen is orientated at an angle of around and the medial oblique distal sesamoidean ligament.
55° to the main magnetic field (Figure 3.212). This Magic angle artifact is particularly noticeable in
magic angle effect must be recognized as it can mimic sequences with a short TE (T1 and PD sequences) and is
lesions in tendons and ligaments. It is most obvious on less evident on sequences with long TE (T2 images).
high‐field images of the distal part of the deep digital Magic angle artifact can be reduced on T2‐weighted
flexor tendon (DDFT) toward its insertion on the distal images by increasing TE time. 194