
Page 428 - Adams and Stashak's Lameness in Horses, 7th Edition
P. 428
394 Chapter 3
VetBooks.ir
Figure 3.215. Sagittal low‐field STIR FSE image of the left front
foot of a show jumper with septic synovitis of the distal interphalangeal
joint and navicular bursa following a nail puncture of the sole. There is
marked and extensive increased signal intensity (osseous fluid)
throughout the spongiosa of both the distal phalanx and the navicular
bone (arrows). Source: Courtesy of Dr. Marieke Zimmerman.
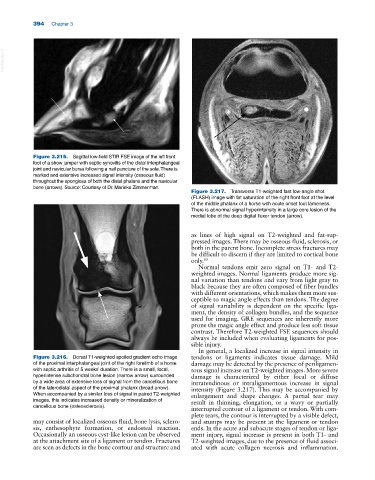
Figure 3.217. Transverse T1‐weighted fast low‐angle shot
(FLASH) image with fat saturation of the right front foot at the level
of the middle phalanx of a horse with acute onset foot lameness.
There is abnormal signal hyperintensity in a large core lesion of the
medial lobe of the deep digital flexor tendon (arrow).
as lines of high signal on T2‐weighted and fat‐sup
pressed images. There may be osseous fluid, sclerosis, or
both in the parent bone. Incomplete stress fractures may
be difficult to discern if they are limited to cortical bone
only. 83
Normal tendons emit zero signal on T1‐ and T2‐
weighted images. Normal ligaments produce more sig
nal variation than tendons and vary from light gray to
black because they are often composed of fiber bundles
with different orientations, which makes them more sus
ceptible to magic angle effects than tendons. The degree
of signal variability is dependent on the specific liga
ment, the density of collagen bundles, and the sequence
used for imaging. GRE sequences are inherently more
prone the magic angle effect and produce less soft tissue
contrast. Therefore T2‐weighted FSE sequences should
always be included when evaluating ligaments for pos
sible injury.
In general, a localized increase in signal intensity in
Figure 3.216. Dorsal T1‐weighted spoiled gradient echo image tendons or ligaments indicates tissue damage. Mild
of the proximal interphalangeal joint of the right forelimb of a horse damage may be detected by the presence of periligamen
with septic arthritis of 5 weeks’ duration. There is a small, focal, tous signal increase on T2‐weighted images. More severe
hyperintense subchondral bone lesion (narrow arrow) surrounded damage is characterized by either focal or diffuse
by a wide area of extensive loss of signal from the cancellous bone intratendinous or intraligamentous increase in signal
of the laterodistal aspect of the proximal phalanx (broad arrow). intensity (Figure 3.217). This may be accompanied by
When accompanied by a similar loss of signal in paired T2‐weighted enlargement and shape changes. A partial tear may
images, this indicates increased density or mineralization of result in thinning, elongation, or a wavy or partially
cancellous bone (osteosclerosis).
interrupted contour of a ligament or tendon. With com
plete tears, the contour is interrupted by a visible defect,
may consist of localized osseous fluid, bone lysis, sclero and stumps may be present at the ligament or tendon
sis, enthesophyte formation, or endosteal reaction. ends. In the acute and subacute stages of tendon or liga
Occasionally an osseous cyst‐like lesion can be observed ment injury, signal increase is present in both T1‐ and
at the attachment site of a ligament or tendon. Fractures T2‐weighted images, due to the presence of fluid associ
are seen as defects in the bone contour and structure and ated with acute collagen necrosis and inflammation.