
Page 429 - Adams and Stashak's Lameness in Horses, 7th Edition
P. 429
Diagnostic Imaging 395
At later stages of fibrosis and healing, T2 signal progres
sively returns to normal, while T1 signal hyperintensity
VetBooks.ir of signal abnormalities in injured tendons and ligaments,
Due to the persistence
persists, often indefinitely.
19,78,88,160
MRI may not be able to establish when a patient with a
tendon or ligament injury can safely resume sporting
activities. One study found that horses whose hyperin
tense tendon or ligament lesions had resolved on STIR
images were significantly more likely to be sound than
78
horses whose lesions persisted on STIR images. On the
other hand, tendon or ligament lesions that were visible
only on T1 GRE images remained of uncertain clinical
significance as a continued association with lameness
was possible. In another study of clinical core lesions in
the digital part of the DDFT, tendons with fascicular
necrosis had signal increase on fat‐suppressed images
and T1‐weighted images, whereas signal intensity in fat‐
suppressed images was normal in core lesions with
fibroplasia rather than necrosis. Similarly, the presence
19
of increased signal on fat‐suppressed images was associ
ated with the most severe histological grades of collagen
fiber disruption in one study of human Achilles
tendinosis. 86
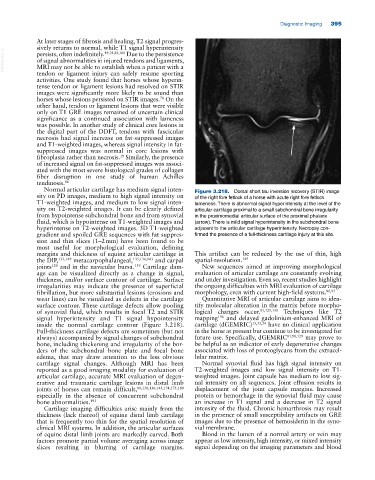
Normal articular cartilage has medium signal inten Figure 3.218. Dorsal short tau inversion recovery (STIR) image
sity on PD images, medium to high signal intensity on of the right fore fetlock of a horse with acute right fore fetlock
T1‐weighted images, and medium to low signal inten lameness. There is abnormal signal hyperintensity at the level of the
sity on T2‐weighted images. It can be clearly defined articular cartilage proximal to a small subchondral bone irregularity
from hypointense subchondral bone and from synovial in the proximomedial articular surface of the proximal phalanx
fluid, which is hypointense on T1‐weighted images and (arrow). There is mild signal hyperintensity in the subchondral bone
hyperintense on T2‐weighted images. 3D T1‐weighted adjacent to the articular cartilage hyperintensity. Necropsy con
gradient and spoiled GRE sequences with fat suppres firmed the presence of a full‐thickness cartilage injury at this site.
sion and thin slices (1–2 mm) have been found to be
most useful for morphological evaluation, defining
margins and thickness of equine articular cartilage in This artifact can be reduced by the use of thin, high
the DIP, 133,149 metacarpophalangeal, 135,136,143 and carpal spatialresolution. 149
120
joints and in the navicular bursa. Cartilage dam New sequences aimed at improving morphological
159
age can be visualized directly as a change in signal, evaluation of articular cartilage are constantly evolving
thickness, and/or surface contour of cartilage. Surface and under investigation. Even so, recent studies highlight
irregularities may indicate the presence of superficial the ongoing difficulties with MRI evaluation of cartilage
fibrillation, but more substantial lesions (erosions and morphology, even with current high‐field systems. 80,95
wear lines) can be visualized as defects in the cartilage Quantitative MRI of articular cartilage aims to iden
surface contour. These cartilage defects allow pooling tify molecular alteration in the matrix before morpho
of synovial fluid, which results in focal T2 and STIR logical changes occur. 81,129,130 Techniques like T2
signal hyperintensity and T1 signal hypointensity mapping and delayed gadolinium‐enhanced MRI of
196
inside the normal cartilage contour (Figure 3.218). cartilage (dGEMRIC) 15,33,34 have no clinical application
Full‐thickness cartilage defects are sometimes (but not in the horse at present but continue to be investigated for
always) accompanied by signal changes of subchondral future use. Specifically, dGEMRIC 81,98,129 may prove to
bone, including thickening and irregularity of the bor be helpful as an indicator of early degenerative changes
ders of the subchondral bone plate and focal bone associated with loss of proteoglycans from the extracel
edema, that may draw attention to the less obvious lular matrix.
cartilage signal changes. Although MRI has been Normal synovial fluid has high signal intensity on
reported as a good imaging modality for evaluation of T2‐weighted images and low signal intensity on T1‐
articular cartilage, accurate MRI evaluation of degen weighted images. Joint capsule has medium to low sig
erative and traumatic cartilage lesions in distal limb nal intensity on all sequences. Joint effusion results in
joints of horses can remain difficult, 80,130,136,143,174,175,180 displacement of the joint capsule margins. Increased
especially in the absence of concurrent subchondral protein or hemorrhage in the synovial fluid may cause
bone abnormalities. 193 an increase in T1 signal and a decrease in T2 signal
Cartilage imaging difficulties arise mainly from the intensity of the fluid. Chronic hemarthrosis may result
thickness (lack thereof) of equine distal limb cartilage in the presence of small susceptibility artifacts on GRE
that is frequently too thin for the spatial resolution of images due to the presence of hemosiderin in the syno
clinical MRI systems. In addition, the articular surfaces vial membrane.
of equine distal limb joints are markedly curved. Both Blood in the lumen of a normal artery or vein may
factors promote partial volume averaging across image appear as low intensity, high intensity, or mixed intensity
slices resulting in blurring of cartilage margins. signal depending on the imaging parameters and blood