
Page 62 - Small Animal Internal Medicine, 6th Edition
P. 62
34 PART I Cardiovascular System Disorders
VetBooks.ir
A
B
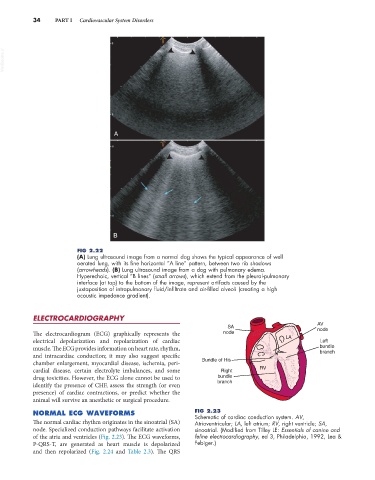
FIG 2.22
(A) Lung ultrasound image from a normal dog shows the typical appearance of well
aerated lung, with its fine horizontal “A line” pattern, between two rib shadows
(arrowheads). (B) Lung ultrasound image from a dog with pulmonary edema.
Hyperechoic, vertical “B lines” (small arrows), which extend from the pleural-pulmonary
interface (at top) to the bottom of the image, represent artifacts caused by the
juxtaposition of intrapulmonary fluid/infiltrate and air-filled alveoli (creating a high
acoustic impedance gradient).
ELECTROCARDIOGRAPHY
SA AV
node
The electrocardiogram (ECG) graphically represents the node LA
electrical depolarization and repolarization of cardiac Left
muscle. The ECG provides information on heart rate, rhythm, bundle
branch
and intracardiac conduction; it may also suggest specific
chamber enlargement, myocardial disease, ischemia, peri- Bundle of His
cardial disease, certain electrolyte imbalances, and some Right RV
drug toxicities. However, the ECG alone cannot be used to bundle
identify the presence of CHF, assess the strength (or even branch
presence) of cardiac contractions, or predict whether the
animal will survive an anesthetic or surgical procedure.
NORMAL ECG WAVEFORMS FIG 2.23
Schematic of cardiac conduction system. AV,
The normal cardiac rhythm originates in the sinoatrial (SA) Atrioventricular; LA, left atrium; RV, right ventricle; SA,
node. Specialized conduction pathways facilitate activation sinoatrial. (Modified from Tilley LE: Essentials of canine and
of the atria and ventricles (Fig. 2.23). The ECG waveforms, feline electrocardiography, ed 3, Philadelphia, 1992, Lea &
P-QRS-T, are generated as heart muscle is depolarized Febiger.)
and then repolarized (Fig. 2.24 and Table 2.3). The QRS