
Page 63 - Small Animal Internal Medicine, 6th Edition
P. 63
CHAPTER 2 Diagnostic Tests for the Cardiovascular System 35
TABLE 2.3
VetBooks.ir Normal Cardiac Waveforms
EVENT
WAVEFORM
P Depolarization (activation) of atrial
muscle; normally is positive in leads II
and aV F
PR interval Time from onset of atrial muscle
activation, through conduction over
the AV node, bundle of His, and
Purkinje fibers; also called PQ interval
QRS complex Depolarization of ventricular muscle; by
definition, Q is the first negative
deflection (if present), R the first
positive deflection, and S is the
negative deflection after the R wave
J point End of the QRS complex (and ventricular
muscle activation); junction of QRS
and ST segment
ST segment Represents the period between
ventricular depolarization and
repolarization (correlates with phase 2
of the action potential)
T wave Ventricular muscle repolarization
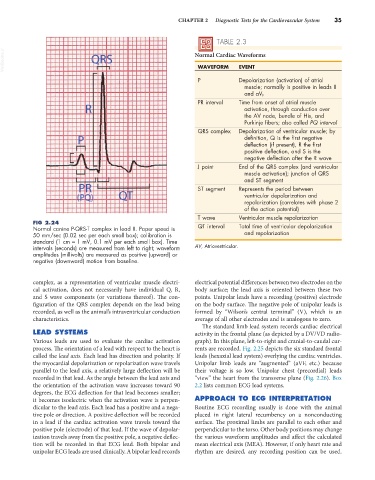
FIG 2.24
Normal canine P-QRS-T complex in lead II. Paper speed is QT interval Total time of ventricular depolarization
50 mm/sec (0.02 sec per each small box); calibration is and repolarization
standard (1 cm = 1 mV, 0.1 mV per each small box). Time
intervals (seconds) are measured from left to right; waveform AV, Atrioventricular.
amplitudes (millivolts) are measured as positive (upward) or
negative (downward) motion from baseline.
complex, as a representation of ventricular muscle electri- electrical potential differences between two electrodes on the
cal activation, does not necessarily have individual Q, R, body surface; the lead axis is oriented between these two
and S wave components (or variations thereof). The con- points. Unipolar leads have a recording (positive) electrode
figuration of the QRS complex depends on the lead being on the body surface. The negative pole of unipolar leads is
recorded, as well as the animal’s intraventricular conduction formed by “Wilson’s central terminal” (V), which is an
characteristics. average of all other electrodes and is analogous to zero.
The standard limb lead system records cardiac electrical
LEAD SYSTEMS activity in the frontal plane (as depicted by a DV/VD radio-
Various leads are used to evaluate the cardiac activation graph). In this plane, left-to-right and cranial-to-caudal cur-
process. The orientation of a lead with respect to the heart is rents are recorded. Fig. 2.25 depicts the six standard frontal
called the lead axis. Each lead has direction and polarity. If leads (hexaxial lead system) overlying the cardiac ventricles.
the myocardial depolarization or repolarization wave travels Unipolar limb leads are “augmented” (aVF, etc.) because
parallel to the lead axis, a relatively large deflection will be their voltage is so low. Unipolar chest (precordial) leads
recorded in that lead. As the angle between the lead axis and “view” the heart from the transverse plane (Fig. 2.26). Box
the orientation of the activation wave increases toward 90 2.2 lists common ECG lead systems.
degrees, the ECG deflection for that lead becomes smaller;
it becomes isoelectric when the activation wave is perpen- APPROACH TO ECG INTERPRETATION
dicular to the lead axis. Each lead has a positive and a nega- Routine ECG recording usually is done with the animal
tive pole or direction. A positive deflection will be recorded placed in right lateral recumbency on a nonconducting
in a lead if the cardiac activation wave travels toward the surface. The proximal limbs are parallel to each other and
positive pole (electrode) of that lead. If the wave of depolar- perpendicular to the torso. Other body positions may change
ization travels away from the positive pole, a negative deflec- the various waveform amplitudes and affect the calculated
tion will be recorded in that ECG lead. Both bipolar and mean electrical axis (MEA). However, if only heart rate and
unipolar ECG leads are used clinically. A bipolar lead records rhythm are desired, any recording position can be used.