
Page 29 - AYZ.indd
P. 29
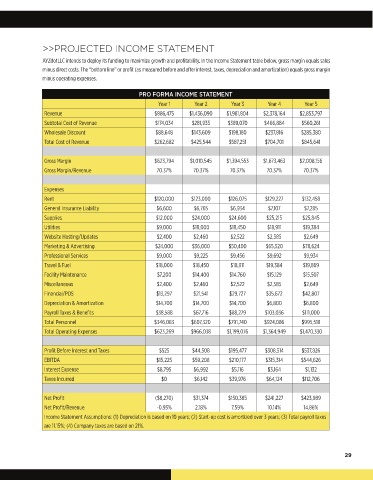
>>PROJECTED INCOME STATEMENT

               AYZdotLLC intends to deploy its funding to maximize growth and profitability. In the Income Statement table below, gross margin equals sales
               minus direct costs. The “bottom line” or profit (as measured before and after interest, taxes, depreciation and amortization) equals gross margin
               minus operating expenses.

                                                PRO FORMA INCOME STATEMENT
                                                       Year 1      Year 2      Year 3      Year 4       Year 5
                Revenue                              $886,475    $1,436,090   $1,981,804   $2,378,164   $2,853,797
                Subtotal Cost of Revenue             $174,034     $281,935    $389,070    $466,884     $560,261
                Wholesale Discount                    $88,648     $143,609    $198,180     $237,816    $285,380
                Total Cost of Revenue                $262,682     $425,544    $587,251     $704,701    $845,641

                Gross Margin                         $623,794    $1,010,545   $1,394,553   $1,673,463   $2,008,156
                Gross Margin/Revenue                  70.37%      70.37%       70.37%      70.37%       70.37%

                Expenses
                Rent                                 $120,000     $123,000    $126,075     $129,227    $132,458
                General Insurance Liability           $6,600       $6,765      $6,934       $7,107      $7,285
                Supplies                              $12,000     $24,000     $24,600      $25,215     $25,845
                Utilities                             $9,000      $18,000      $18,450     $18,911     $19,384
                Website Hosting/Updates               $2,400      $2,460       $2,522      $2,585       $2,649
                Marketing & Advertising               $24,000     $36,000     $50,400      $65,520     $78,624
                Professional Services                 $9,000       $9,225      $9,456      $9,692       $9,934
                Travel & Fuel                         $18,000     $18,450      $18,911     $19,384     $19,869
                Facility Maintenance                  $7,200      $14,400      $14,760     $15,129     $15,507
                Miscellaneous                         $2,400      $2,460       $2,522      $2,585       $2,649
                Financial/POS                         $13,297     $21,541      $29,727     $35,672     $42,807
                Depreciation & Amortization           $14,700     $14,700      $14,700     $6,800       $6,800
                Payroll Taxes & Benefits              $38,588     $67,716     $88,279      $103,036    $111,000
                Total Personnel                      $346,083     $607,320    $791,740    $924,086     $995,518
                Total Operating Expenses             $623,269     $966,038    $1,199,076  $1,364,949  $1,470,330

                Profit Before Interest and Taxes       $525       $44,508     $195,477     $308,514    $537,826
                EBITDA                                $15,225     $59,208     $210,177     $315,314    $544,626
                Interest Expense                      $8,795      $6,992       $5,116      $3,164       $1,132
                Taxes Incurred                          $0         $6,142     $39,976      $64,124     $112,706

                Net Profit                           ($8,270)     $31,374     $150,385     $241,227    $423,989
                Net Profit/Revenue                    -0.93%       2.18%       7.59%       10.14%       14.86%
                Income Statement Assumptions: (1) Depreciation is based on 10 years; (2) Start-up cost is amortized over 3 years; (3) Total payroll taxes
                are 11.15%; (4) Company taxes are based on 21%.


                                                                                                                     29