
Page 30 - AYZ.indd
P. 30
AYZDOTLLC
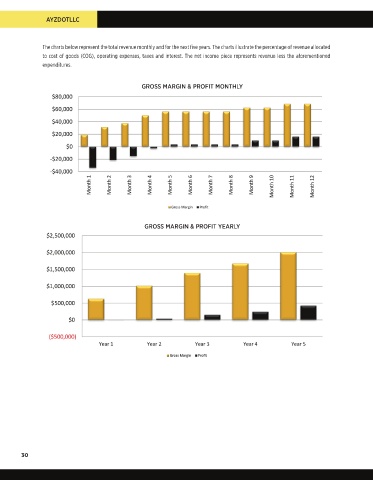
The charts below represent the total revenue monthly and for the next five years. The charts illustrate the percentage of revenue allocated
to cost of goods (COG), operating expenses, taxes and interest. The net income piece represents revenue less the aforementioned
expenditures.
GROSS MARGIN & PROFIT MONTHLY
GROSS MARGIN & PROFIT YEARLY
30