
Page 354 - Six Sigma Advanced Tools for Black Belts and Master Black Belts
P. 354
OTE/SPH
OTE/SPH
3:7
Char Count= 0
JWBK119-21
August 31, 2006
Conclusion 339
Table 21.8 The values of ˆp and the control limits with conventionel estimator from Table
21.6.
No. CCC ˆ p (ppm) LCL UCL No. CCC ˆ p (ppm) LCL UCL
1 3706 -- 12 25965 16 753 300 12 25965
2 9179 -- 12 25965 17 3345 300 12 25965
3 78 -- 12 25965 18 217 360 12 21081
4 1442 -- 12 25965 19 3008 360 12 21081
5 409 -- 12 25965 20 3270 360 12 21081
6 3812 300 12 25965 21 5074 360 12 21081
7 7302 300 12 25965 22 3910 360 12 21081
8 726 300 12 25965 23 23310 360 12 21081
9 2971 300 12 25965 24 11690 360 12 21081
10 42 300 12 25965 25 19807 360 12 21081
11 3134 300 12 25965 26 14703 360 12 21081
12 1583 300 12 25965 27 4084 360 12 21081
13 3917 300 12 25965 28 826 360 12 21081
14 3496 300 12 25965 29 9484 360 12 21081
15 2424 300 12 25965 30 66782 360 12 21081
21.6 CONCLUSION
In this chapter, the basic properties of CCC charts as well as CCC schemes with es-
timated parameters are revisited. A set of comprehensive guidelines is given for the
construction of CCC charts, when p 0 is known and when p 0 is estimated by two dif-
ferent schemes. In addition, the associated parameters for constructing CCC charts
with the most commonly used in-control ARLs are given in Tables 21.1 and 21.2. Ter-
mination and suspension rules are introduced for the CCC scheme with sequentially
100000.00
10000.00
1000.00
100.00
10.00
1.00
0 5 10 15 20 25 30
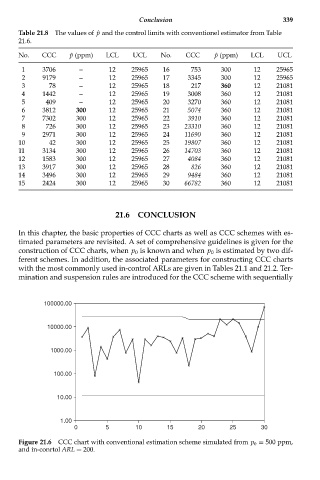
Figure 21.6 CCC chart with conventional estimation scheme simulated from p 0 = 500 ppm,
and in-conrtol ARL = 200.