
Page 353 - Six Sigma Advanced Tools for Black Belts and Master Black Belts
P. 353
OTE/SPH
OTE/SPH
August 31, 2006
3:7
JWBK119-21
Char Count= 0
338 Establishing Cumulative Conformance Count Charts
Table 21.7 The values of ¯p and the control limits with sequential estimator from Table 21.6.
No. CCC ¯ p (ppm) LCL UCL No. CCC ¯ p (ppm) LCL UCL
1 3 706 -- -- -- 16 753 303 12 23 023
2 9 179 78 31 105 092 17 3 345 303 12 23 189
3 78 154 19 51 689 18 217 303 12 21 923
4 1 442 154 19 51 689 19 3 008 303 12 21 988
5 4 09 154 19 51 689 20 3 270 347 11 21 864
6 3 812 268 12 29 410 21 5 074 334 12 22 693
7 7 302 231 15 33 847 22 3 910 329 13 23 024
8 726 263 13 29 651 23 23 310 329 13 23 024
9 2 971 270 13 28 709 24 11 690 329 13 23 024
10 42 303 12 25 462 25 19 807 329 13 23 024
11 3 134 303 12 25 462 26 14 703 329 13 23 024
12 1 583 303 12 25 462 27 4,084 329 13 23 024
13 3 917 303 12 25 462 28 826 329 13 23 024
14 3 496 303 12 25 462 29 9 484 329 13 23 024
15 2 424 303 12 25 462 30 66 782 329 13 22 897
If conventional estimation is used, ˆp is 300 ppm, for an initial sample size n = 20 000.
With ARL 0 specified at 200, ρ ≥ 2.5, and R c = 1.170, n * = 50 000 (obtained by using
equations (21.15) and (21.22)). Table 21.8 gives the values of the estimates together
with the control limits. The estimate is updated once when the sample size collected
reaches 50 000, which is the 18th observation in Table 21.8, as there is no out-of-control
signal observed between the 7th and 18th plotted points.
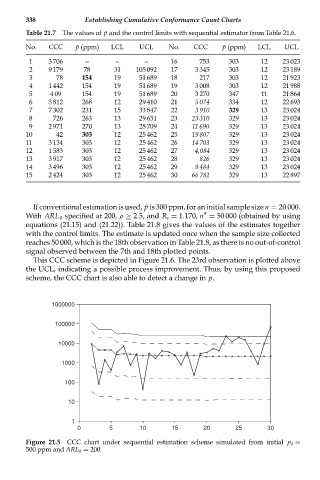
This CCC scheme is depicted in Figure 21.6. The 23rd observation is plotted above
the UCL, indicating a possible process improvement. Thus, by using this proposed
scheme, the CCC chart is also able to detect a change in p.
1000000
100000
10000
1000
100
10
1
0 5 10 15 20 25 30
Figure 21.5 CCC chart under sequential estimation scheme simulated from initial p 0 =
500 ppm and ARL 0 = 200.