
Page 355 - Six Sigma Advanced Tools for Black Belts and Master Black Belts
P. 355
OTE/SPH
OTE/SPH
August 31, 2006
Char Count= 0
3:7
JWBK119-21
340 Establishing Cumulative Conformance Count Charts
Constructing CCC
Chart
Specify
ARL
0
Obtain φ from
(21.18) and Yes Known p ?
0
γ φ (21.4)
No
Start plotting using
control limits from
(21.5) and (21.6) Estimation of p using No Estimation of p 0
0
with respective sequential estimation from conventional estimator
f and γ (21.9)? from (21.14)
f
Yes
Obtain the respective
values of φ and γ
Obtain the n φn
respective values from (21.15)
of φ and γ from and (21.4)
m φm
Table 21.2
Specify ρ and
Specify ρ and determine the value
Keep updating the determine the value of R and obtain the
c
estimate and No Is the point within the of R and obtain the minimum number of
s
control limits as m warning zone? respective m* samples needed, n*
increases
Yes
Start plotting using Start plotting using
Updating is suspended control limits from control limits from
and process monitoring is (21.10) and (21.16) and (21.17)
continued with current No (21.11) with respective with respective
control limits φ and γ φm φ and γ φn
m
n
New estimate is
initiated and
compared with the Is m > m* ? Keep updating the
suspended Is n > n* ? No estimate and
estimate control limits as n
increases
Yes
Stop updating,
Process restarted No Is there significant continue with the Yes
with new estimate difference between 2 process monitoring
estimates? using current control
limits
Yes
Combine the data
and proceed with
updating
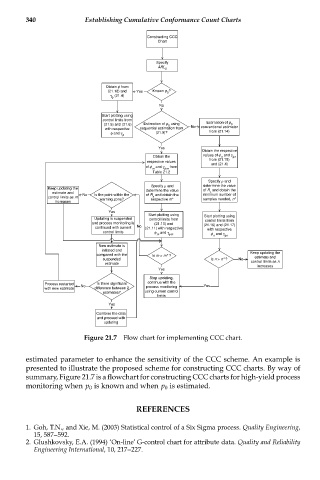
Figure 21.7 Flow chart for implementing CCC chart.
estimated parameter to enhance the sensitivity of the CCC scheme. An example is
presented to illustrate the proposed scheme for constructing CCC charts. By way of
summary, Figure 21.7 is a flowchart for constructing CCC charts for high-yield process
monitoring when p 0 is known and when p 0 is estimated.
REFERENCES
1. Goh, T.N., and Xie, M. (2003) Statistical control of a Six Sigma process. Quality Engineering,
15, 587--592.
2. Glushkovsky, E.A. (1994) ‘On-line’ G-control chart for attribute data. Quality and Reliability
Engineering International, 10, 217--227.