
Page 352 - Six Sigma Advanced Tools for Black Belts and Master Black Belts
P. 352
OTE/SPH
OTE/SPH
3:7
Char Count= 0
JWBK119-21
August 31, 2006
Numerical Examples 337
5
Table 21.6 A set of data for a simulated process (from Table I, Xie et al. ).
Nonconforming Simulation Nonconforming Simulation
no. CCC legend no. CCC legend
1 3 706 p = 500 ppm 16 753 p = 500 ppm
2 9 179 p = 500 ppm 17 3 345 p = 500 ppm
3 78 p = 500 ppm 18 217 p = 500 ppm
4 1 442 p = 500 ppm 19 3 008 p = 500 ppm
5 409 p = 500 ppm 20 3 270 p = 500 ppm
6 3 812 p = 500 ppm 21 5 074 Shift, p = 50 ppm
7 7 302 p = 500 ppm 22 3 910 p = 50 ppm
8 726 p = 500 ppm 23 23 310 p = 50 ppm
9 2 971 p = 500 ppm 24 11 690 p = 50 ppm
10 42 p = 500 ppm 25 19 807 p = 50 ppm
11 3 134 p = 500 ppm 26 14 703 p = 50 ppm
12 1 583 p = 500 ppm 27 4 084 p = 50 ppm
13 3 917 p = 500 ppm 28 826 p = 50 ppm
14 3 496 p = 500 ppm 29 9 484 p = 50 ppm
15 2 424 p = 500 ppm 30 66 782 p = 50 ppm
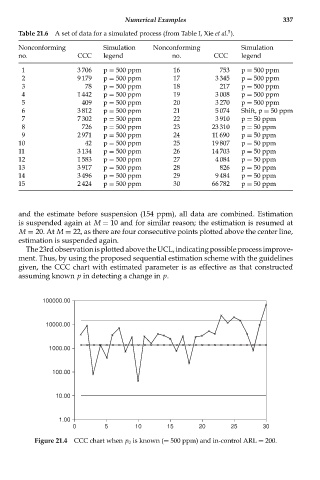
and the estimate before suspension (154 ppm), all data are combined. Estimation
is suspended again at M = 10 and for similar reason; the estimation is resumed at
M = 20. At M = 22, as there are four consecutive points plotted above the center line,
estimation is suspended again.
The23rdobservationisplottedabovetheUCL,indicatingpossibleprocessimprove-
ment. Thus, by using the proposed sequential estimation scheme with the guidelines
given, the CCC chart with estimated parameter is as effective as that constructed
assuming known p in detecting a change in p.
100000.00
10000.00
1000.00
100.00
10.00
1.00
0 5 10 15 20 25 30
Figure 21.4 CCC chart when p 0 is known (= 500 ppm) and in-control ARL = 200.