
Page 146 - TX_Marketing 2_M1_v2
P. 146
A pie chart requires mutually exclusive groupings. A bar graph might work, but it
might also prove misleading. That is, if you don't really want to compare the
numbers, then why attribute "heights" to the numbers on a chart? It's just not very
helpful. A line graph shares the same problem as a bar graph, but would probably
be harder to read as well.
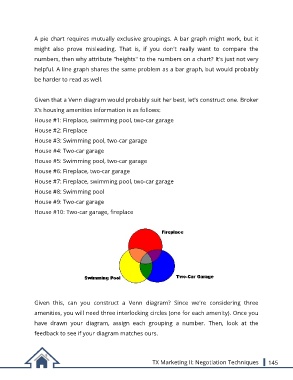
Given that a Venn diagram would probably suit her best, let's construct one. Broker
X's housing amenities information is as follows:
House #1: Fireplace, swimming pool, two-car garage
House #2: Fireplace
House #3: Swimming pool, two-car garage
House #4: Two-car garage
House #5: Swimming pool, two-car garage
House #6: Fireplace, two-car garage
House #7: Fireplace, swimming pool, two-car garage
House #8: Swimming pool
House #9: Two-car garage
House #10: Two-car garage, fireplace
Given this, can you construct a Venn diagram? Since we're considering three
amenities, you will need three interlocking circles (one for each amenity). Once you
have drawn your diagram, assign each grouping a number. Then, look at the
feedback to see if your diagram matches ours.
TX Marketing II: Negotiation Techniques 145