
Page 91 - Atlas of Histology with Functional Correlations
P. 91
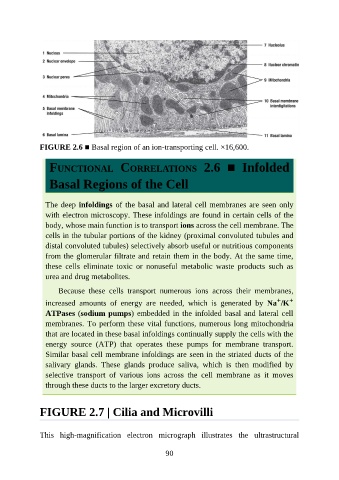
FIGURE 2.6 ■ Basal region of an ion-transporting cell. ×16,600.


                  FUNCTIONAL  CORRELATIONS  2.6  ■  Infolded

                  Basal Regions of the Cell


                 The deep infoldings of the basal and lateral cell membranes are seen only
                 with electron microscopy. These infoldings are found in certain cells of the

                 body, whose main function is to transport ions across the cell membrane. The
                 cells in the tubular portions of the kidney (proximal convoluted tubules and
                 distal convoluted tubules) selectively absorb useful or nutritious components

                 from the glomerular filtrate and retain them in the body. At the same time,
                 these  cells  eliminate  toxic  or  nonuseful  metabolic  waste  products  such  as
                 urea and drug metabolites.

                     Because  these  cells  transport  numerous  ions  across  their  membranes,
                                                                                                  +
                 increased  amounts  of  energy  are  needed,  which  is  generated  by  Na /K         +
                 ATPases (sodium pumps) embedded in the infolded basal and lateral cell
                 membranes. To perform these vital functions, numerous long mitochondria
                 that are located in these basal infoldings continually supply the cells with the

                 energy  source  (ATP)  that  operates  these  pumps  for  membrane  transport.
                 Similar basal cell membrane infoldings are seen in the striated ducts of the
                 salivary  glands.  These  glands  produce  saliva,  which  is  then  modified  by

                 selective  transport  of  various  ions  across  the  cell  membrane  as  it  moves
                 through these ducts to the larger excretory ducts.


               FIGURE 2.7 | Cilia and Microvilli


               This  high-magnification  electron  micrograph  illustrates  the  ultrastructural


                                                           90