
Page 451 - Maxwell House
P. 451
MORE COMPLICATED ELEMENTS OF FEED LINES 431
Since such effect is reversible, the high-frequency crystal vibrations after acoustic filtering may
well be turned back into filtered RF signal.
The detail examination of acoustic filters would lead us too far from the subject of this book
requiring knowledge of many chapters from solid-state physics, crystallography in particularly.
We refer the reader to the specialized literature [21]. Some of the innovative filtering
applications that are being used to address unique challenges in the modern Long-Term
Evolution (LTE or 4G) environment are explored in [22]. The most common Surface Acoustic
Wave (SAW) filters are currently realized in frequency ranges between 30 MHz and up to 5
GHz. The term “surface” means that the acoustic energy is concentrated nearby the planar face
of the piezoelectric substrate in the same manner as EM surface waves (look back at Chapter
6). SAW filters are probably the most abundant type of filters and can be found, for example,
in any cell phone, GPS receiver, or TV set.
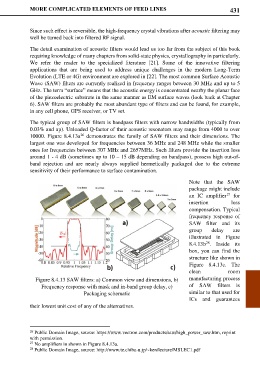
The typical group of SAW filters is bandpass filters with narrow bandwidths (typically from
0.03% and up). Unloaded Q-factor of their acoustic resonators may range from 4000 to over
26
10000. Figure 8.4.13a demonstrates the family of SAW filters and their dimensions. The
largest one was developed for frequencies between 36 MHz and 248 MHz while the smaller
ones for frequencies between 307 MHz and 2657MHz. Such filters provide the insertion loss
around 1 - 4 dB (sometimes up to 10 – 15 dB depending on bandpass), possess high out-of-
band rejection and are nearly always supplied hermetically packaged due to the extreme
sensitivity of their performance to surface contamination.
Note that the SAW
package might include
27
an IC amplifier for
insertion loss
compensation. Typical
frequency response of
SAW filter and its
group delay are
illustrated in Figure
8.4.13b . Inside its
28
box, you can find the
structure like shown in
Figure 8.4.13c. The
clean room
Figure 8.4.13 SAW filters: a) Common view and dimensions, b) manufacturing process
Frequency response with mask and in-band group delay, c) of SAW filters is
Packaging schematic similar to that used for
ICs and guarantees
their lowest unit cost of any of the alternatives.
26 Public Domain Image, source: https://www.vectron.com/products/saw/high_power_saw.htm, reprint
with permission.
27 No amplifiers in shown in Figure 8.4.13a.
28 Public Domain Image, source: http://www.te.chiba-u.jp/~ken/lecture/MSLEC1.pdf