
Page 452 - Maxwell House
P. 452
432 Chapter 8
8.4.11 Filter Selection Trade-off
Table 8.3 is the ballpark classification illustrating the filter applications in different frequency
bands. We used data from Dr. Ming Yu’s lecture “The Art & Science of Microwave Filter
29
Design” with his permission.
Table 8.3
8.4.12 Optical Filters
a) b)
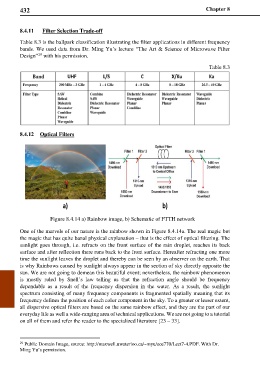
Figure 8.4.14 a) Rainbow image, b) Schematic of FTTH network
One of the marvels of our nature is the rainbow shown in Figure 8.4.14a. The real magic but
the magic that has quite banal physical explanation – that is the effect of optical filtering. The
sunlight goes through, i.e. refracts on the front surface of the rain droplet, reaches its back
surface and after reflection there runs back to the front surface. Hereafter refracting one more
time the sunlight leaves the droplet and thereby can be seen by an observer on the earth. That
is why Rainbows caused by sunlight always appear in the section of sky directly opposite the
sun. We are not going to demean this beautiful event; nevertheless, the rainbow phenomenon
is mostly ruled by Snell’s law telling us that the refraction angle should be frequency
dependable as a result of the frequency dispersion in the water. As a result, the sunlight
spectrum consisting of many frequency components is fragmented spatially meaning that its
frequency defines the position of each color component in the sky. To a greater or lesser extent,
all dispersive optical filters are based on the same rainbow effect, and they are the part of our
everyday life as well a wide-ranging area of technical applications. We are not going to a tutorial
on all of them and refer the reader to the specialized literature [23 – 33].
29 Public Domain Image, source: http://maxwell.uwaterloo.ca/~myu/ece770/Lect7-4.PDF. With Dr.
Ming Yu’s permission.