
Page 18 - Shroeder - Filter Systems
P. 18
Determining the Residual Dirt Quantity of
Components and Technical Cleanliness
Determining the residual dirt quantities present on components can be done by employing quantitative
and qualitative factors.
Quantitative: ■ mg/component
■ mg/surface unit (oil-wetted surface)
■ mg/kg component weight no. of particles > x µm/component
■ no. of particles > x µm/surface unit (oil-wetted surface)
Qualitative: ■ Length of largest particle (subdivision into hard/soft)
Components with easily accessible surfaces are components in which only the outer surface is of interest
for the most part when performing residual dirt analyses. There are exceptions e.g. trans mission and pump
housings, as the internal surface is of interest. These components belong to group 1 and their surfaces are
not easily accessible in most cases.
Components in which the inner surfaces are examined or pre-assembled assemblies belong to group 2.
There are two methods that can be used to determine the residual dirt of group 1 components.
Ultrasonic The ultrasound method involves submitting
Method the components to an ultrasonic bath,
exposing them for a defined period of time
at a defined ultrasonic setting and bath
temperature. The particulate contamination is
loosened by the exposure and then flushed off
the component using a suitable liquid.
The particle dispersion in the flushing liquid
obtained in this manner is analyzed according
to specified evaluation methods.
The ultrasonic energy setting and the
duration of exposure have to be indicated in
reporting the result. The ultrasonic procedure
is particu larly suitable for small components in
which all surfaces have to be examined. Cast
components and elastomers should not be
subjected to ultrasonic washing if possible. A
risk is posed here by the carbon inclusions in
the cast piece being dissolved, thus skewing
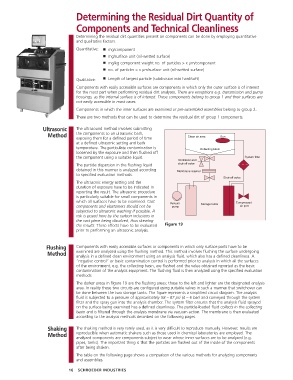
the results. These effects have to be evaluated Figure 19
prior to performing an ultrasonic analysis.
Flushing Components with easily accessible surfaces or components in which only surface parts have to be
Method examined are analyzed using the flushing method. This method involves flushing the surface undergoing
analysis in a defined clean environment using an analysis fluid, which also has a defined cleanliness. A
“negative control” or basic contamination control is performed prior to analysis in which all the surfaces
of the environment, e.g. the collecting basin, are flushed and the value obtained reported as the basic
contamination of the analysis equipment. The flushing fluid is then analyzed using the specified evaluation
methods.
The darker areas in Figure 19 are the flushing areas; those to the left and lighter are the designated analysis
area. In reality these two circuits are configured using suitable valves in such a manner that switchover can
be done between the two storage tanks. The figure represents a simplified circuit diagram. The analysis
fluid is subjected to a pressure of approximately 58 – 87 psi (4 – 6 bar) and conveyed through the system
filter and the spray gun into the analysis chamber. The system filter ensures that the analysis fluid sprayed
on the surface being examined has a defined cleanliness. The particle-loaded fluid collects in the collecting
basin and is filtered through the analysis membrane via vacuum action. The membrane is then evaluated
according to the analysis methods described on the following pages.
Shaking The shaking method is very rarely used, as it is very difficult to reproduce manually. However, results are
Method reproducible when automatic shakers such as those used in chemical laboratories are employed. The
analyzed components are components subject to wear whose inner surfaces are to be analyzed (e.g.
pipes, tanks). The important thing is that the particles are flushed out of the inside of the components
after being shaken.
The table on the following page shows a comparison of the various methods for analyzing components
and assemblies.
16 SCHROEDER INDUSTRIES