
Page 234 - SKU-000506274_TEXT.indd
P. 234
C h a p t e r 1 9 Tracking Performance 213
graph to expand or contract the time period; click one or more areas on the map to
determine from which regions you wish to include data.
Figure 19.5 Selecting which time period and region(s) to analyze.
Note
The time and region controls are the same for all insight pages.
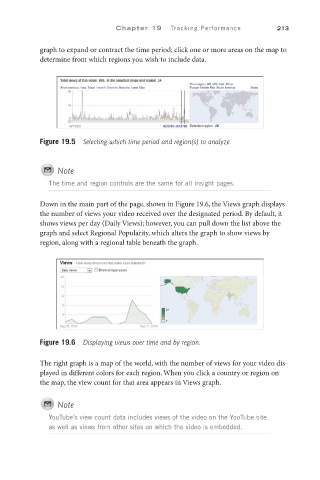
Down in the main part of the page, shown in Figure 19.6, the Views graph displays
the number of views your video received over the designated period. By default, it
shows views per day (Daily Views); however, you can pull down the list above the
graph and select Regional Popularity, which alters the graph to show views by
region, along with a regional table beneath the graph.
Figure 19.6 Displaying views over time and by region.
The right graph is a map of the world, with the number of views for your video dis-
played in different colors for each region. When you click a country or region on
the map, the view count for that area appears in Views graph.
Note
YouTube’s view count data includes views of the video on the YouTube site
as well as views from other sites on which the video is embedded.