
Page 12 - Tlahuizcalli CB-30_Neat
P. 12
scintillator, and the second one corresponds to the A list of the NIM modules employed, along with
electron produced by its decay. Channel 3 their specifications can be found in Appendix B. Fig.
(purple) illustrates the signal coming from the Gate (4) shows all the NIM modules assembled and
Delay generator, meaning that that’s how the connected in a NIM bin.
10 width gate looks like. Note that it’s slightly
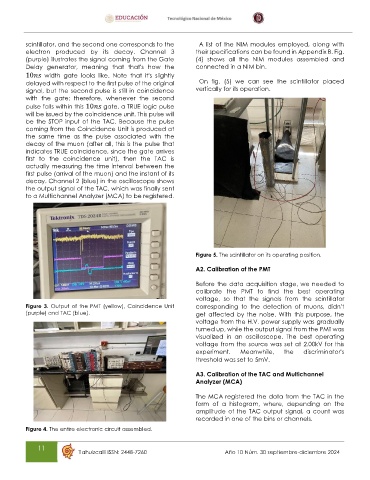
delayed with respect to the first pulse of the original On fig. (5) we can see the scintillator placed
signal, but the second pulse is still in coincidence vertically for its operation.
with the gate; therefore, whenever the second
pulse falls within this 10 gate, a TRUE logic pulse
will be issued by the coincidence unit. This pulse will
be the STOP input of the TAC. Because the pulse
coming from the Coincidence Unit is produced at
the same time as the pulse associated with the
decay of the muon (after all, this is the pulse that
indicates TRUE coincidence, since the gate arrives
first to the coincidence unit), then the TAC is
actually measuring the time interval between the
first pulse (arrival of the muon) and the instant of its
decay. Channel 2 (blue) in the oscilloscope shows
the output signal of the TAC, which was finally sent
to a Multichannel Analyzer (MCA) to be registered.
Figure 5. The scintillator on its operating position.
A2. Calibration of the PMT
Before the data acquisition stage, we needed to
calibrate the PMT to find the best operating
voltage, so that the signals from the scintillator
Figure 3. Output of the PMT (yellow), Coincidence Unit corresponding to the detection of muons, didn’t
(purple) and TAC (blue). get affected by the noise. With this purpose, the
voltage from the H.V. power supply was gradually
turned up, while the output signal from the PMT was
visualized in an oscilloscope. The best operating
voltage from the source was set at 2.00kV for this
experiment. Meanwhile, the discriminator’s
threshold was set to 5mV.
A3. Calibration of the TAC and Multichannel
Analyzer (MCA)
The MCA registered the data from the TAC in the
form of a histogram, where, depending on the
amplitude of the TAC output signal, a count was
recorded in one of the bins or channels.
Figure 4. The entire electronic circuit assembled.
11
Tlahuizcalli ISSN: 2448-7260 Año 10 Núm. 30 septiembre-diciembre 2024