
Page 13 - Tlahuizcalli CB-30_Neat
P. 13
In order to convert the registered counts into time weeks. After that, the operating voltage of the PMT
values, we needed to calibrate it with pulses was lowered to 1.95kV to reduce the noise, and it
separated by a previously known time difference. was put into operation for another week.
A pulse generator was used to produce 2 pulses
separated by a known time interval, that could be The MCA collected the data in the form of a
set manually. These pulses were then fed to the TAC histogram, indicating the amount of muons or
as START and STOP inputs. The amplitudes for events per channel or bin. The bins of the histogram
different time separations were registered using the represented the amplitudes of the TAC signal,
MCA. Fig. (6) shows the distribution on the which are related to the decay time of the
histogram, of the different time intervals measured. detected muons through the calibration curve in
The difference between two consecutive peaks is fig. (7). The collected data was exported for further
1μs. analysis through the USX spectroscopy software, an
accompanying software through which the UCS30
MCA is operated.
B. Measurement of the speed of cosmic ray muons
The second part of the experiment consisted in
measuring the speed of the incoming muons that
are generated in the upper atmosphere from
cosmic rays.
For this purpose, two scintillators were placed on
top of each other, separated by a variable
distance as shown in fig. (8); the upper detector
was fixed, while the lower one could be moved
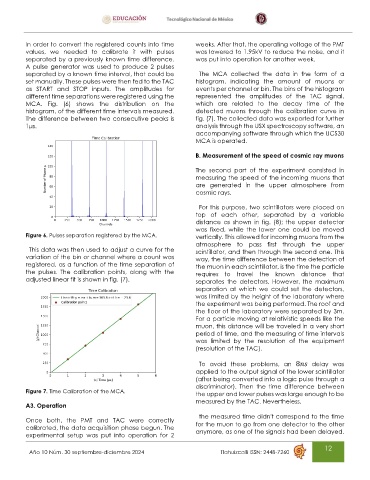
Figure 6. Pulses separation registered by the MCA. vertically. This allowed for incoming muons from the
atmosphere to pass first through the upper
This data was then used to adjust a curve for the scintillator, and then through the second one. This
variation of the bin or channel where a count was way, the time difference between the detection of
registered, as a function of the time separation of the muon in each scintillator, is the time the particle
the pulses. The calibration points, along with the requires to travel the known distance that
adjusted linear fit is shown in fig. (7). separates the detectors. However, the maximum
separation at which we could set the detectors,
was limited by the height of the laboratory where
the experiment was being performed. The roof and
the floor of the laboratory were separated by 3m.
For a particle moving at relativistic speeds like the
muon, this distance will be traveled in a very short
period of time, and the measuring of time intervals
was limited by the resolution of the equipment
(resolution of the TAC).
To avoid these problems, an 8 delay was
applied to the output signal of the lower scintillator
(after being converted into a logic pulse through a
discriminator). Then the time difference between
Figure 7. Time Calibration of the MCA. the upper and lower pulses was large enough to be
measured by the TAC. Nevertheless,
A3. Operation
the measured time didn’t correspond to the time
Once both, the PMT and TAC were correctly
calibrated, the data acquisition phase begun. The for the muon to go from one detector to the other
experimental setup was put into operation for 2 anymore, as one of the signals had been delayed.
12
Año 10 Núm. 30 septiembre-diciembre 2024 Tlahuizcalli ISSN: 2448-7260