
Page 16 - Tlahuizcalli CB-30_Neat
P. 16
III. Results
A. Muon’s mean lifetime
A1. PMT operating voltage of 2.00kV
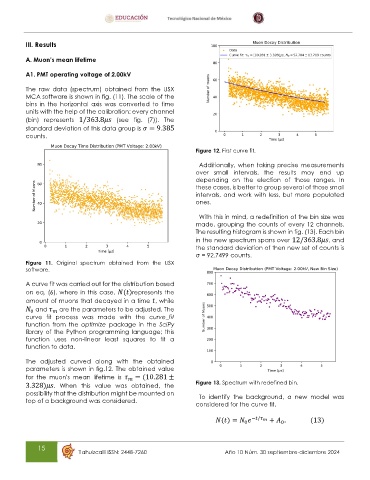
The raw data (spectrum) obtained from the USX
MCA software is shown in fig. (11). The scale of the
bins in the horizontal axis was converted to time
units with the help of the calibration: every channel
(bin) represents 1/363.8 (see fig. (7)). The
standard deviation of this data group is = 9.385
counts.
Figure 12. First curve fit.
Additionally, when taking precise measurements
over small intervals, the results may end up
depending on the election of those ranges. In
these cases, is better to group several of those small
intervals, and work with less, but more populated
ones.
With this in mind, a redefinition of the bin size was
made, grouping the counts of every 12 channels.
The resulting histogram is shown in fig. (13). Each bin
in the new spectrum spans over 12/363.8 , and
the standard deviation of then new set of counts is
σ = 92.7499 counts.
Figure 11. Original spectrum obtained from the USX
software.
A curve fit was carried out for the distribution based
on eq. (6), where in this case, ( )represents the
amount of muons that decayed in a time , while
and are the parameters to be adjusted. The
0
curve fit process was made with the curve_fit
function from the optimize package in the SciPy
library of the Python programming language; this
function uses non-linear least squares to fit a
function to data.
The adjusted curved along with the obtained
parameters is shown in fig.12. The obtained value
for the muon's mean lifetime is = (10.281 ±
3.328) . When this value was obtained, the Figure 13. Spectrum with redefined bin.
possibility that the distribution might be mounted on To identify the background, a new model was
top of a background was considered.
considered for the curve fit,
( ) = − / + . (13)
0
0
15
Tlahuizcalli ISSN: 2448-7260 Año 10 Núm. 30 septiembre-diciembre 2024