Page 19 - Tlahuizcalli CB-30_Neat
P. 19

Once  again  a  non-constant  background  was          expected  for  a  massive  particle  produced  by
          identified and subtracted from the data. The final      cosmic rays in the upper atmosphere
          distribution in the time interval from 12     to 21     is
          shown in fig. (23).                                     IV. Discussion

                                                                  A. Muon’s mean lifetime

                                                                  The results were initially affected by the presence of
                                                                  a background in the distribution of the decay times
                                                                  for  the  muons  detected.  The  photomultiplier  had
                                                                  been calibrated to an optimal operating voltage,
                                                                  so  that  the  signals  produced  by  the  muons  were
                                                                  clearly distinguished. In addition to this, the signals
                                                                  were  sent  through  a  discriminator  where  a
                                                                  threshold  was  set,  establishing  a  lower  bound  for
                                                                  the pulses that were observed. These factors lead
                                                                  to believe that the origin of the background may
                                                                  not  be  the  electronic  noise  produced  by  the
                                                                  experimental  setup.  However,  there’s  always  the
                                                                  possibility  that  some  unexpected  noise  could  be
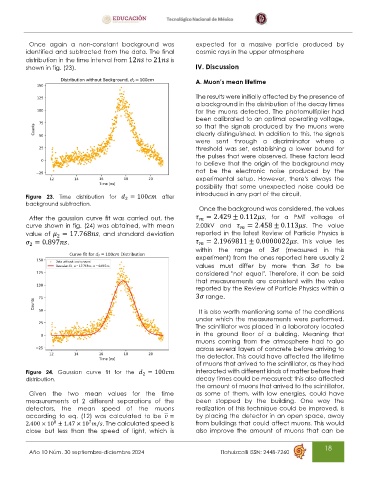
          Figure  23.  Time  distribution  for     = 100      after   introduced in any part of the circuit.
                                          2
          background subtraction.
                                                                   Once the background was considered, the values
           After the gaussian curve fit was carried  out, the        = 2.429 ± 0.112    ,  for  a  PMT  voltage  of
                                                                     
          curve shown in fig. (24) was obtained, with mean        2.00kV  and     = 2.458 ± 0.113    .  The  value
                                                                                  
          value of    = 17.768    ,  and  standard deviation      reported  in the latest Review of Particle Physics  is
                    2
             = 0.897    .                                            = 2.1969811 ± 0.0000022    .  This  value  lies
                                                                     
           2
                                                                  within  the  range  of  3    (measured  in  this
                                                                  experiment) from the ones reported here usually 2
                                                                  values  must  differ  by  more  than  3    to  be
                                                                  considered  "not  equal".  Therefore,  it  can  be  said
                                                                  that  measurements  are  consistent  with  the  value
                                                                  reported by the Review of Particle Physics within a
                                                                  3   range.


                                                                   It is also worth mentioning some of the conditions
                                                                  under  which  the  measurements  were  performed.
                                                                  The scintillator was placed in a laboratory located
                                                                  in  the  ground  floor  of  a  building.  Meaning  that
                                                                  muons  coming  from  the  atmosphere  had  to  go
                                                                  across several layers of concrete before arriving to
                                                                  the detector. This could have affected the lifetime
                                                                  of muons that arrived to the scintillator, as they had
          Figure  24.  Gaussian  curve  fit  for  the     = 100       interacted with different kinds of matter before their
                                                2
          distribution.                                           decay times could be measured; this also affected
                                                                  the amount of muons that arrived to the scintillator,
           Given  the  two  mean  values  for  the  time          as  some  of  them,  with  low  energies,  could  have
          measurements  of  2  different  separations  of  the    been  stopped  by  the  building.  One  way  the
          detectors,  the  mean  speed  of  the  muons            realization of this technique could be improved, is
          according  to  eq.  (12)  was  calculated  to  be     =  by placing the detector in an open space, away
          2.400 × 10 ± 1.47 × 10   /  . The calculated speed is   from buildings that could affect muons. This would
                   8
                              7
          close  but  less  than  the  speed  of  light,  which  is   also  improve  the  amount  of  muons  that  can  be

                                                                                                            18
           Año 10 Núm. 30 septiembre-diciembre 2024                                    Tlahuizcalli ISSN: 2448-7260
   14   15   16   17   18   19   20   21   22   23   24