
Page 15 - Tlahuizcalli CB-30_Neat
P. 15
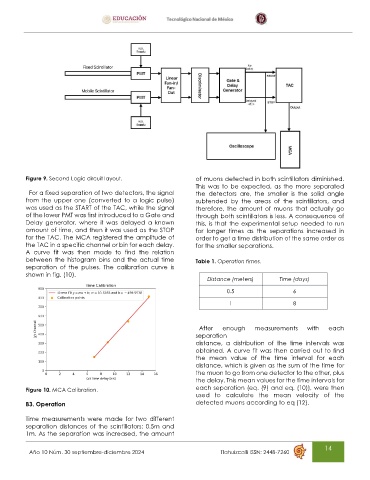
Figure 9. Second Logic circuit layout.                  of muons detected in both scintillators diminished.
                                                                  This was to be expected, as the more  separated
           For a fixed separation of two detectors, the signal    the  detectors  are,  the  smaller  is  the  solid  angle
          from  the  upper  one  (converted  to  a  logic  pulse)   subtended  by  the  areas  of  the  scintillators,  and
          was used as the START of the TAC, while the signal      therefore,  the  amount  of  muons  that  actually  go
          of the lower PMT was first introduced to a Gate and     through both scintillators is less. A consequence of
          Delay  generator,  where  it  was  delayed  a  known    this, is that the experimental setup needed to run
          amount of time, and then it was used as the STOP        for  longer  times  as  the  separations  increased  in
          for the TAC. The MCA registered the amplitude of        order to get a time distribution of the same order as
          the TAC in a specific channel or bin for each delay.    for the smaller separations.
          A  curve  fit  was  then  made  to  find  the  relation
          between  the histogram  bins  and  the  actual  time    Table 1. Operation times.
          separation  of  the  pulses.  The  calibration  curve  is
          shown in fig. (10).
                                                                      Distance (meters)       Time (days)
                                                                            0.5                   6

                                                                             1                    8


                                                                   After   enough    measurements      with   each
                                                                  separation
                                                                  distance,  a  distribution  of  the  time  intervals  was
                                                                  obtained. A curve fit was then carried out to find
                                                                  the  mean  value  of  the  time  interval  for  each
                                                                  distance, which is given as the sum of the time for
                                                                  the muon to go from one detector to the other, plus
                                                                  the delay. This mean values for the time intervals for
          Figure 10. MCA Calibration.                             each separation (eq. (9) and eq. (10)), were then
                                                                  used  to  calculate  the  mean  velocity  of  the
          B3. Operation                                           detected muons according to eq (12).


          Time  measurements  were  made  for  two  different
          separation distances of the scintillators:  0.5m and
          1m. As the separation was increased, the amount

                                                                                                            14
           Año 10 Núm. 30 septiembre-diciembre 2024                                    Tlahuizcalli ISSN: 2448-7260